Why Traders Are Looking for Finviz Alternatives in 2026
Finviz has been a staple in the retail trading world since 2007. The stock screener, the heat map, the snapshot pages — they became so embedded in how people discover and filter stocks that "Finviz" became shorthand for "stock screener." I used it for years myself. Still pull it up sometimes out of habit.
But the platform has stagnated. The free tier has not evolved meaningfully in years. The screener still uses the same filter-based grid from a decade ago. The charting is basic — delayed data, limited indicators, no drawing tools worth using. There is no AI, no real-time alerts on the free plan, and no way to combine fundamental and technical screening into one intelligent workflow. And the heat map, while iconic, is a visualization tool — not an analysis tool.
Finviz Elite addresses some of these issues at $24.96/month ($299.50/year), adding real-time data, advanced charts, backtesting, and premarket screener access. But in 2026, that price point puts it in direct competition with platforms that offer significantly more — AI-driven screening, conversational assistants, insider data, superinvestor tracking, and full fundamental analysis panels. The gap between what Finviz offers and what modern platforms deliver has widened every year.
The reasons traders look for Finviz alternatives fall into a few clear categories:
- They want AI-powered screening, not manual filters. Finviz's screener is still a static filter grid. Modern platforms use AI to score, rank, and surface stocks based on composite signals across technical, fundamental, and sentiment data — without the user having to manually configure 20 filter dropdowns.
- They need real-time data without paying $300/year. Finviz's free data is delayed 15-20 minutes. For active traders, that makes the screener and charts nearly useless for intraday decisions. Several alternatives offer real-time data for free or at a fraction of Elite's cost.
- They want charting that actually works. Finviz's charting is a limitation, not a feature. No drawing tools, no multi-chart layouts, no timeframe flexibility on the free plan. Traders who use Finviz for screening typically have to open a second platform for charting — which defeats the purpose of an integrated workflow.
- They want deeper fundamentals. Finviz's snapshot page covers the basics, but it does not offer income statements, balance sheets, cash flow history, insider trading data, or superinvestor portfolio tracking. Traders doing real due diligence need more depth.
- The interface feels outdated. Finviz has not had a meaningful design refresh in years. The data density is good, but the user experience does not match what modern web applications deliver.
Here are the ten best alternatives I found after testing each one against my daily workflow as a software engineer who trades every day. I evaluated screening depth, data quality, AI features, charting capabilities, fundamental coverage, and whether the free tier is genuinely usable.
How I Ranked These Platforms
I have been building ChartingLens for the past two years, so I will be transparent: it is my product and it is ranked first. I believe the ranking is justified — and the feature comparisons are honest — but you should know the context. Every other platform on this list is ranked based on how well it replaces Finviz's core functionality for different types of traders.
My ranking criteria, weighted in order of importance:
- Screening quality. How well can this platform surface actionable stock ideas? This includes screener depth, the intelligence of the filtering system, and whether it goes beyond static filters into AI scoring or composite ranking.
- Fundamental data depth. Finviz users rely heavily on the snapshot page for quick fundamental checks. Alternatives need to match or exceed that — income statements, balance sheets, analyst targets, insider data, institutional ownership.
- Free tier viability. Can you actually use the platform without paying? Finviz's free tier is limited by delayed data and basic charts. Alternatives that gate core features behind paywalls ranked lower.
- Charting capability. Since Finviz charting is weak, a strong alternative should combine screening and charting in one workflow — real-time data, technical indicators, drawing tools, multi-chart layouts.
- AI and automation. Static filter screeners are being replaced by AI-driven signal generation, automated pattern recognition, and conversational analysis tools. Platforms with AI features ranked higher because they represent where screening is going.
- Price-to-value ratio. What do you get for what you pay? A platform offering more than Finviz Elite for less money scores well.
I also looked at how each platform compares to other tools I have reviewed previously, including TC2000 alternatives and Koyfin alternatives, to provide consistent cross-platform perspective.
Quick Comparison Table
| Platform | Free Tier | Screener | Heat Maps | AI Features | Paid From |
|---|---|---|---|---|---|
| ChartingLens | Yes | AI + CL Score | Signal dashboard | Signals + Assistant + Patterns | Free / $9.99/mo |
| TradingView | Limited | Advanced filters | Interactive | No | $29.95/mo |
| Barchart | Yes | Multi-asset | Yes | No | $19.99/mo |
| Stock Analysis | Yes | Valuation-focused | No | No | $14.99/mo |
| TC2000 | No | EasyScan formulas | No | No | $14.99/mo |
| Koyfin | Yes | Dashboard filters | Limited | No | $27/mo |
| Seeking Alpha | Limited | Quant grades | No | Quant ratings | $239/yr |
| TrendSpider | No | Auto-scan | No | Auto trendlines + patterns | $22/mo |
| Simply Wall St | Limited | Visual screener | No | No | $10/mo |
| Yahoo Finance | Yes | Basic filters | Basic | No | $35/mo |
All 10 Platforms, Ranked
1. ChartingLens — Best Overall Finviz Alternative
If you use Finviz primarily for stock screening, fundamental snapshots, and discovering trade ideas, ChartingLens replaces that entire workflow and adds layers Finviz does not have at any price tier. It is the platform I built because the Finviz-to-charting-platform pipeline felt broken — screening in one tab, charting in another, fundamentals in a third. ChartingLens puts it all in one place.
The CL Score is the direct replacement for Finviz's screener. Instead of manually configuring filter dropdowns for P/E ratios, market cap, and performance metrics, the CL Score is a composite AI ranking that scores 2,000+ stocks daily across technical momentum, fundamental health, and sentiment signals. You see the top-ranked stocks immediately — no configuration needed. The AI buy/sell signal engine scans the same universe and flags stocks with directional conviction, giving you a curated watchlist instead of a raw filter output.
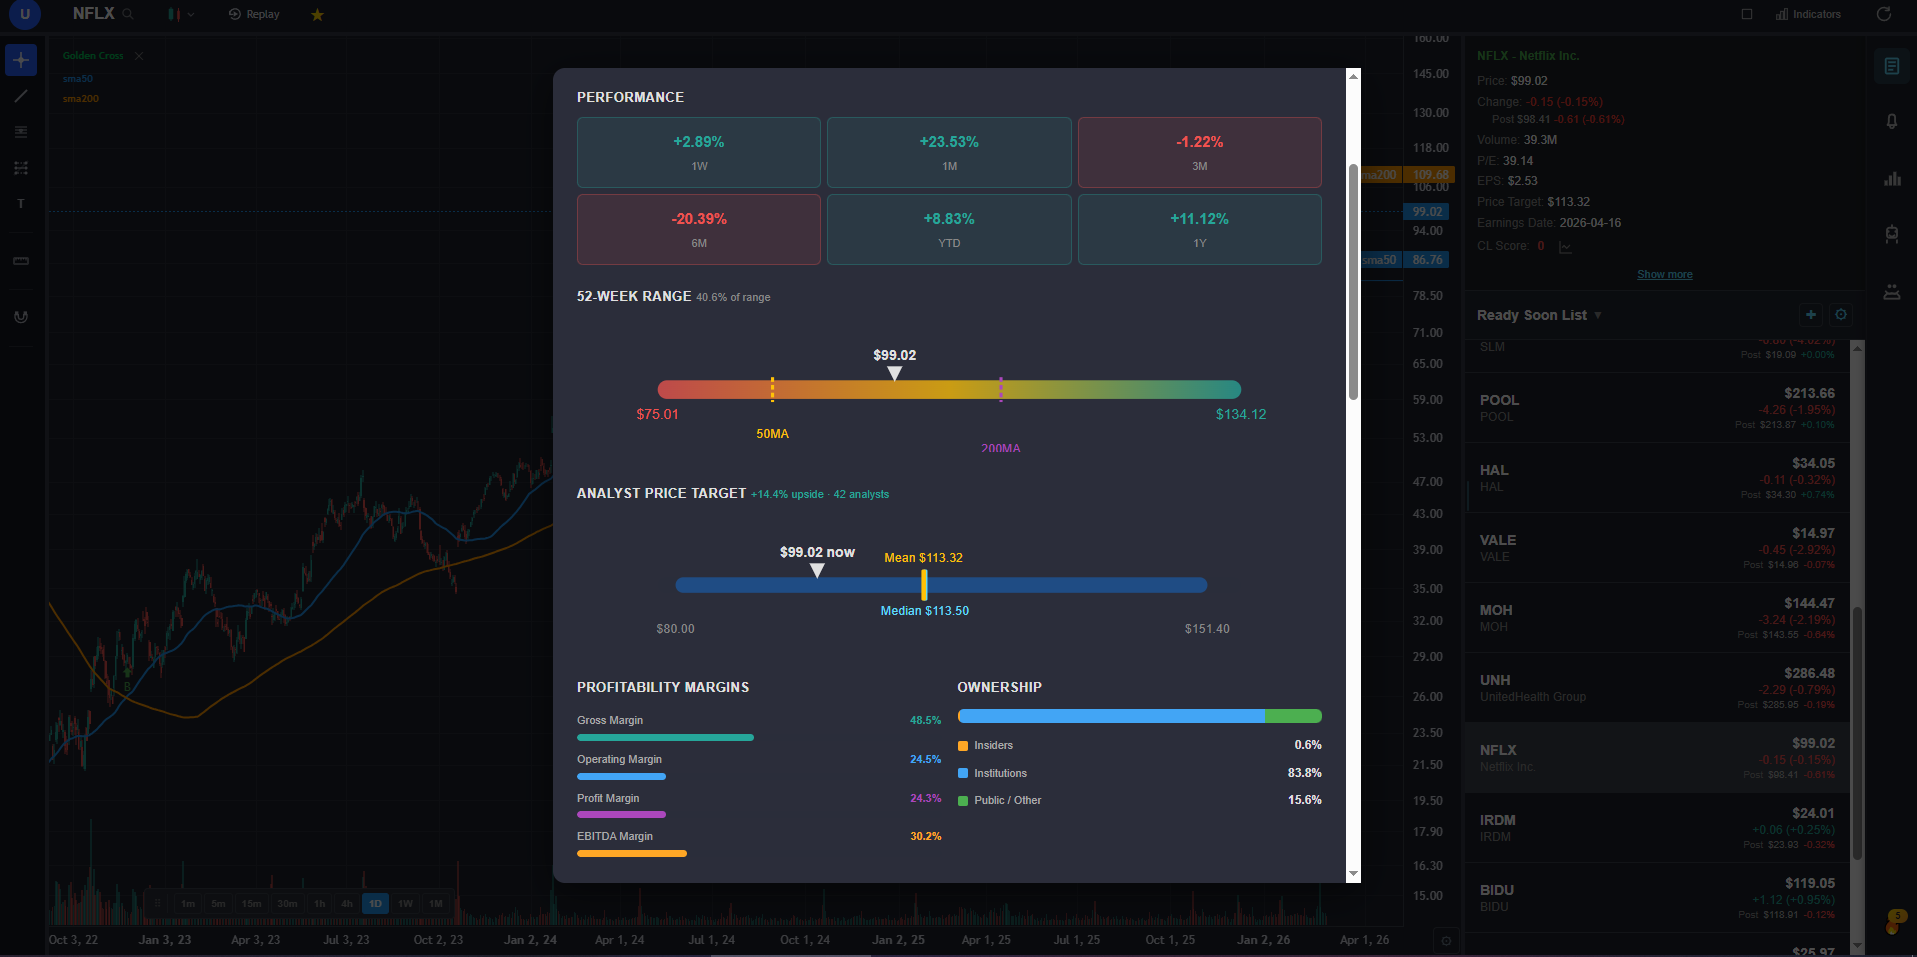
The fundamentals panel goes deeper than Finviz's snapshot page. You get full income statements, balance sheets, and cash flow history — not just current-quarter ratios. Analyst price targets, profitability margins, revenue growth trends, and institutional ownership data are all inline. The insider trading data pulls directly from SEC filings so you can see exactly what executives are buying and selling. The superinvestor tracker follows the portfolio moves of top fund managers from their 13F filings — a data layer Finviz does not offer at all.
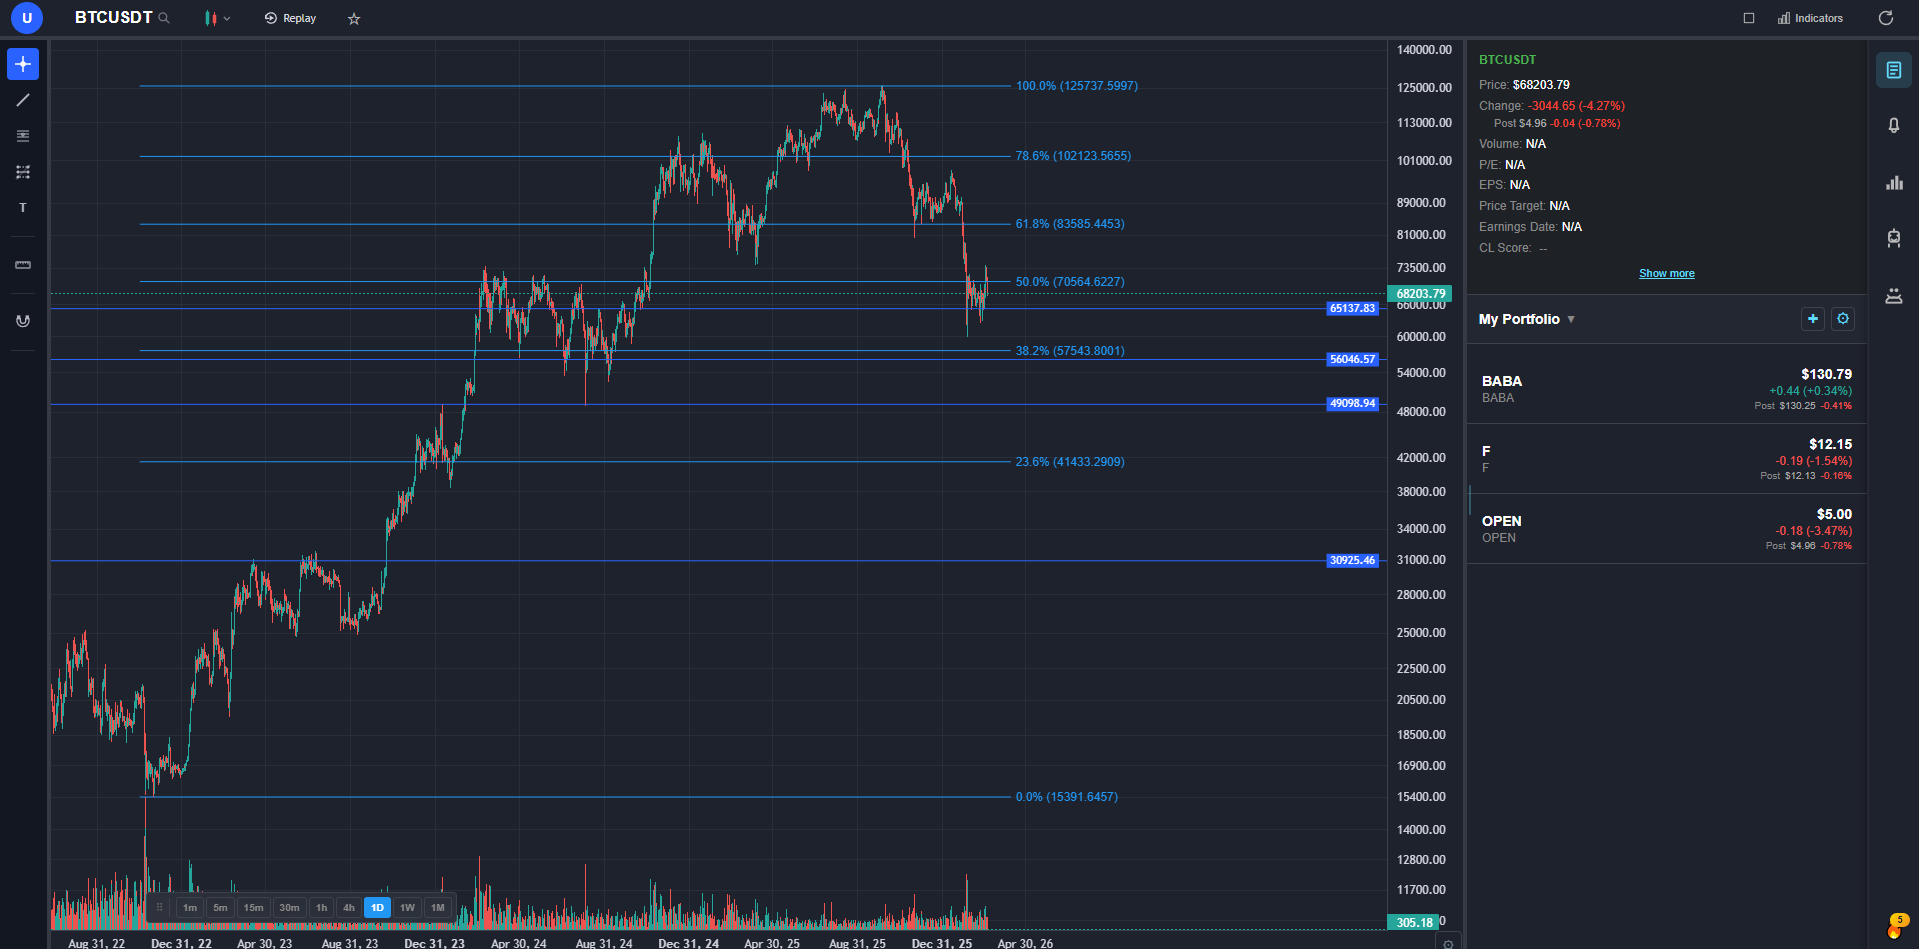
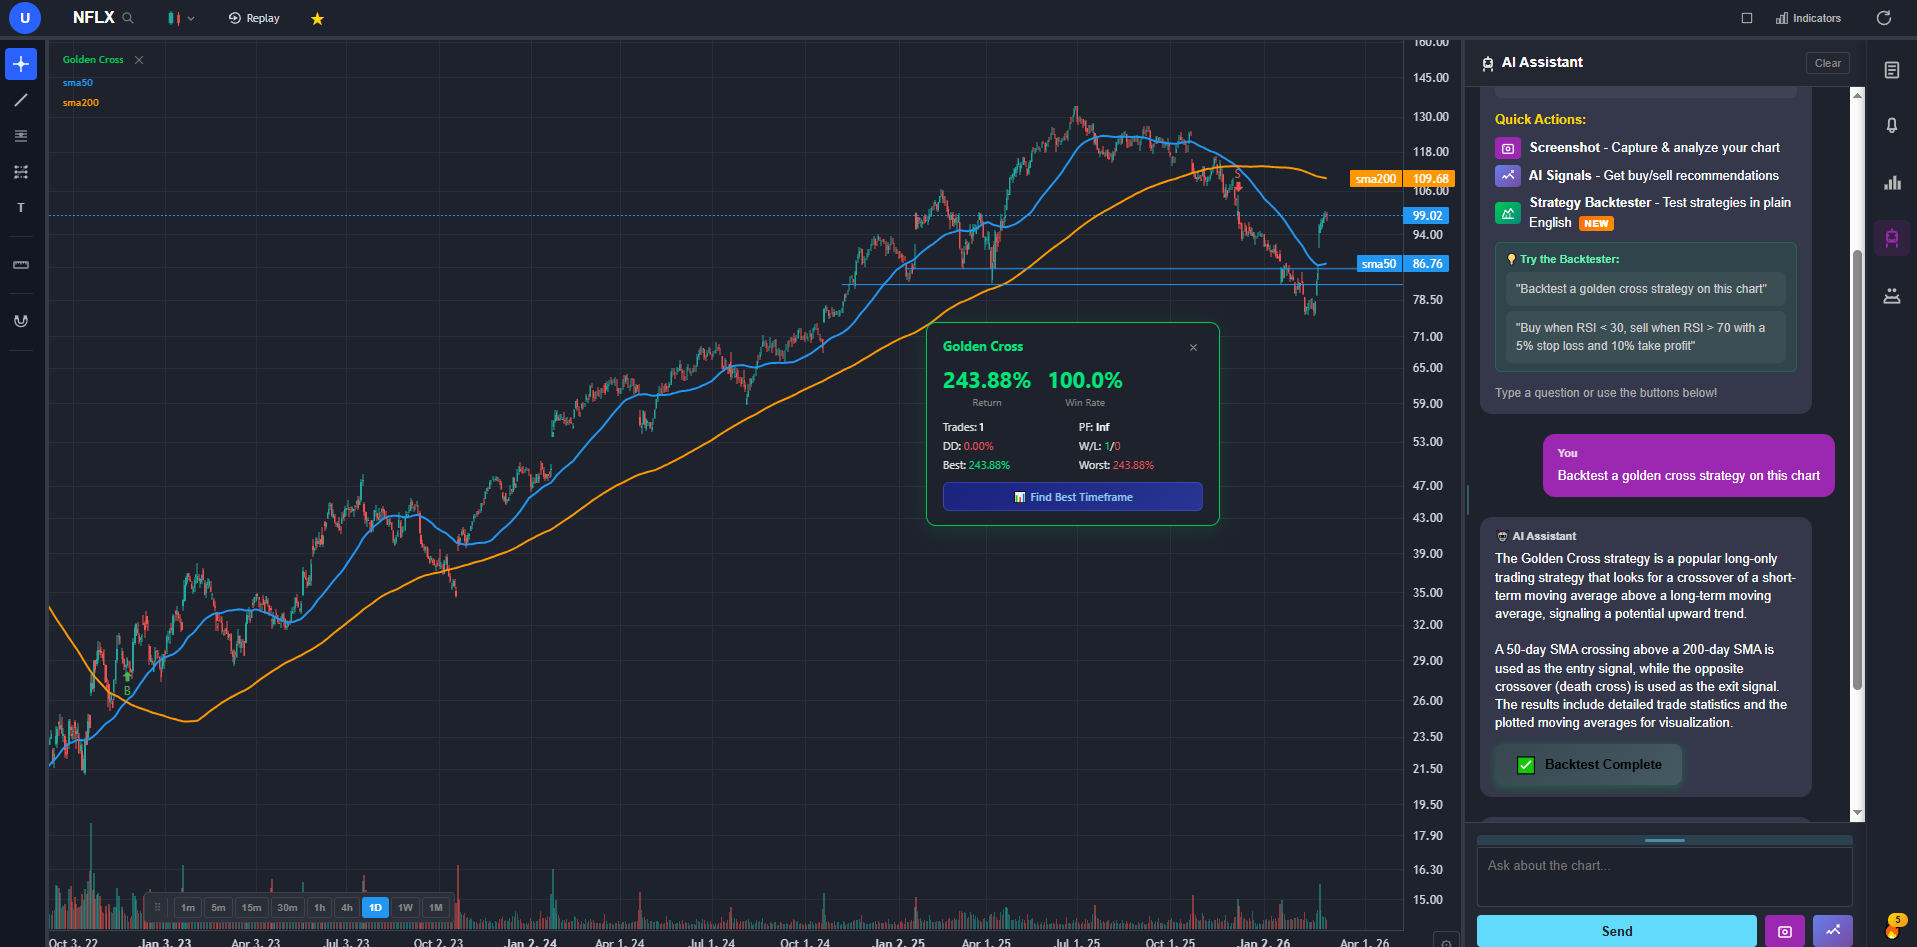
The charting side solves the other half of the Finviz problem. Real-time stock and crypto charts, 15+ technical indicators with no per-chart cap, all standard drawing tools synced to the cloud, timeframes from 1 minute to monthly, multi-chart layouts, and pre/post market data. The AI trading assistant knows your current chart context and can draw support and resistance zones on demand. Automated chart pattern recognition flags head-and-shoulders, double tops, wedges, triangles, and other formations directly on the chart. The plain-English strategy backtester lets you describe a strategy in natural language and runs it with return, Sharpe ratio, win rate, and max drawdown stats — no coding.
The free tier covers most features. Premium is $9.99/mo — less than half what Finviz Elite costs annually, and with significantly more functionality. If you are paying for Finviz Elite or running the free screener alongside two other tools to fill the gaps, ChartingLens consolidates all of that.
2. TradingView — Best Interactive Charting + Screener
TradingView is the most widely used web charting platform and its stock screener has evolved into a genuine Finviz competitor. The screener supports custom filter combinations across fundamental, technical, and performance metrics. The interactive heat map is the best Finviz heat map alternative available — you can size by market cap, performance, volume, or custom metrics, and drill into individual sectors with full interactivity. The charting is best-in-class for a browser-based platform.
The screener is good but static — it does not score or rank stocks intelligently like an AI system would. You still have to know what filters to set and interpret the results yourself. The free tier is restrictive: one indicator per chart, limited screener access, and ads. The Plus plan at $29.95/month gets you usable screening and five indicators per chart. There are no AI signals, no insider data, and no superinvestor tracking.
For traders who need the heat map specifically and want interactive charting integrated with screening, TradingView is the strongest option. For traders who want AI-driven stock discovery and deeper fundamental data, ChartingLens covers more ground at a lower price point.
3. Barchart — Best Free Data Breadth
Barchart is the closest thing to a "Finviz but with more data" alternative. The free tier covers stocks, ETFs, futures, forex, and options — broader multi-asset coverage than Finviz offers. The screener includes over 100 filter criteria and the unusual options activity feed adds a data layer that active traders use daily. Heat map views are available. The site also publishes daily stock signals, upgrades/downgrades, and earnings data on dedicated pages.
The interface is data-dense in a way that feels familiar to Finviz users — tables, numbers, minimal decoration. The charting includes 150+ indicators and is more capable than Finviz's charts, though still below TradingView or ChartingLens for interactive analysis. There are no AI features, no pattern recognition, and no backtesting. Premium at $19.99/month unlocks real-time data and additional screener filters.
If you like Finviz's approach — lots of tabular data, minimal UI overhead — and want the same thing with broader asset coverage and better options data, Barchart is the natural step up. For AI screening, insider data, or superinvestor tracking, you still need ChartingLens alongside it.
4. Stock Analysis — Best Free Valuation Screener
Stock Analysis (stockanalysis.com) has quietly become one of the best free fundamental data sources on the web. The stock pages include full financial statements going back years — income statement, balance sheet, cash flow — plus analyst estimates, dividend history, and IPO tracking. The screener is focused on valuation and fundamental metrics, making it a strong Finviz replacement for traders who screen primarily on P/E, revenue growth, margins, and balance sheet health.
The free tier is genuinely generous. You get full financial data, the screener, and stock pages without creating an account. The premium at $14.99/mo adds additional screener filters, watchlist features, and data exports. The site is fast, clean, and well-organized.
Stock Analysis does not have charting, AI features, insider data visualization, or superinvestor tracking. It is purely a fundamental data and screening platform. For traders who combine fundamental screening with technical analysis, pairing Stock Analysis with ChartingLens gives you the best of both — or just use ChartingLens, which covers fundamentals natively alongside AI signals and charting.
5. TC2000 — Best EasyScan Power Screening
TC2000 is the power screener for traders who think in formulas. The EasyScan engine lets you build custom screening conditions using a formula-based syntax that is more flexible than any filter dropdown interface — including Finviz's. You can combine price action, volume conditions, indicator crossovers, and fundamental thresholds into complex multi-condition scans and run them in real-time. For traders who found Finviz's screener too rigid, TC2000 removes the ceiling.
The charting is solid — clean, fast, with good indicator support. Real-time alerts integrate with the scans. The learning curve is moderate: EasyScan is not a full programming language, but it requires more technical thinking than Finviz's point-and-click filters.
There is no free tier — Silver starts at $14.99/mo. No AI features, no heat maps, no insider data. TC2000 is a specialist screening and charting tool. If you are a formula-oriented screener who needs maximum flexibility, TC2000 is unmatched. For traders who want intelligent stock discovery without building formulas, ChartingLens delivers that through AI scoring and signals with no configuration.
6. Koyfin — Best Dashboard-Style Analysis
Koyfin positions itself as the Bloomberg Terminal for retail investors, and the comparison is not entirely wrong. The dashboard interface lets you build custom views combining financial data, charts, economic indicators, and market overviews into a single workspace. The data depth is impressive — financial statements, valuation multiples, peer comparisons, and macro overlays are all accessible through a well-designed interface that feels more institutional than retail.
The screener is filter-based with good fundamental coverage. The dashboard-style layout works well for traders who monitor multiple watchlists and want everything visible at once. The free tier is usable but limited to a few dashboards and basic data. The Plus plan at $27/month unlocks more dashboards, data depth, and export capabilities.
Koyfin does not have AI features, insider trading data, superinvestor tracking, or automated pattern recognition. It is a data visualization and monitoring platform — strong for portfolio-level analysis but not for active stock discovery the way Finviz or ChartingLens approaches it. If you like the idea of building custom financial dashboards with institutional-grade data, Koyfin is the best option at this price point.
7. Seeking Alpha — Best Quant Ratings
Seeking Alpha takes a unique approach to stock screening through its proprietary Quant Rating system. Every stock gets graded across five factors: valuation, growth, profitability, momentum, and EPS revisions. These factor grades (A+ through F) create a composite rating that surfaces stocks with strong multi-factor profiles. For traders who used Finviz to screen on multiple fundamental dimensions simultaneously, Seeking Alpha's quant grades do the same thing but with a pre-built scoring system.
The platform also aggregates crowdsourced analyst articles, earnings call transcripts, and dividend analysis. The community content adds qualitative context that pure data platforms lack. The stock pages include financial statements, estimates, and dividend data.
The free tier limits article access and quant features. Premium at $239/year unlocks full quant ratings and screener access. There are no charting tools, no heat maps, and no real-time data in the traditional sense. Seeking Alpha is strongest as a fundamental scoring and research layer, not a complete Finviz replacement. For the charting and technical screening half, ChartingLens fills the gap.
8. TrendSpider — Best Automated Technical Scanning
TrendSpider is the technical analysis specialist on this list. Its core value proposition is automated trendline detection, multi-timeframe analysis overlays, and auto-pattern recognition that scans charts for formations without manual input. For traders who used Finviz primarily for its technical screener filters — moving average crossovers, RSI thresholds, price patterns — TrendSpider automates that entire workflow at a deeper level.
The market scanner lets you set up automated scans for custom technical conditions across your watchlist. Alerts trigger when conditions are met. The multi-timeframe view overlays daily, weekly, and monthly trendlines on a single chart — a feature that helps identify confluences that are invisible on a single timeframe.
There is no free tier. Plans start at $22/month for basic features, with the full scanner and automation tools on higher tiers up to $79/month. The platform is purely technical — no fundamental data, no insider tracking, no heat maps. For traders who want a technically-focused Finviz replacement with automation, TrendSpider is specialized. For a platform that combines AI-powered technical signals with fundamentals, insider data, and screening, ChartingLens covers all of that in its free tier.
9. Simply Wall St — Best Visual Fundamental Analysis
Simply Wall St takes a radically different approach to stock analysis: everything is visual. The signature "snowflake" diagram rates each stock across five dimensions — value, future growth, past performance, health, and dividends — creating an instantly readable visual summary. For traders who found Finviz's snapshot pages too text-heavy and wanted a quicker way to assess a stock's fundamental profile, Simply Wall St delivers that.
The stock pages include DCF valuation models, ownership breakdowns, dividend analysis, and peer comparisons — all presented through infographics and visual dashboards rather than spreadsheet-style tables. The screener is visual too, letting you filter and browse stocks through visual cards rather than dense data grids. Portfolio health checks show your exposure and risk factors graphically.
The free tier limits you to a few stock analyses per month. The premium at $10/month unlocks unlimited access. There is no charting, no technical indicators, no AI signals, and no real-time data. Simply Wall St is a pure fundamental visualization tool. For the screening and charting workflow that Finviz users rely on, you would need to pair it with ChartingLens or another charting platform.
10. Yahoo Finance — Best Free Basic Screener
Yahoo Finance is the default financial data source for most retail investors and it offers a basic stock screener that handles simple filtering well. You can screen by market cap, sector, P/E ratio, dividend yield, price performance, and other standard metrics. The stock pages include financial statements, analyst estimates, institutional holders, and news — a solid free fundamental snapshot.
The screener is functional but limited compared to Finviz — fewer filter options, less granularity, and no way to combine technical and fundamental criteria effectively. The charting is basic with limited indicators. The Yahoo Finance Plus plan at $35/month adds enhanced screener features, advanced charting, and additional data, but at that price it competes with platforms that offer significantly more.
Yahoo Finance works as a free starting point for casual screening and quick fundamental checks. It is not a Finviz replacement for active traders — the screener is too basic, the charting too limited. For serious screening with AI signals, ChartingLens is free and far more capable. Yahoo Finance earns its spot because it is free, widely known, and available without any account creation.
Best Pick by Trader Type
Different traders use Finviz for different reasons. Here is the best alternative depending on your primary use case:
- Best all-in-one Finviz replacement: ChartingLens — AI screening, fundamentals, insider data, superinvestor tracking, and real-time charting in one platform. Free.
- Best for heat map lovers: TradingView — the most interactive and customizable heat map available, with integrated screening and charting.
- Best free data breadth: Barchart — widest multi-asset coverage on a free tier, closest to Finviz's data-dense approach.
- Best for value investors: Stock Analysis — deepest free financial statement data and valuation-focused screening.
- Best for power screeners: TC2000 — EasyScan formula engine for traders who want maximum screening flexibility.
- Best for dashboard builders: Koyfin — customizable dashboards with institutional-grade data visualization.
- Best for quant-style investors: Seeking Alpha — proprietary multi-factor grading system with crowdsourced analysis.
- Best for automated technicals: TrendSpider — auto-trendlines, auto-patterns, and multi-timeframe scanning.
- Best for visual learners: Simply Wall St — infographic-style fundamental analysis with snowflake diagrams.
- Best free starter tool: Yahoo Finance — basic screening and fundamental data with zero barrier to entry.
Bottom Line
Finviz was a trailblazer. The heat map introduced an entire generation of retail traders to market visualization. The screener taught people how to filter stocks systematically. The snapshot pages made fundamental data accessible before most platforms bothered to try. It deserves credit for what it built.
But the platform has not kept up. The free tier runs on delayed data. The screener is still a static filter grid in a world that has moved to AI scoring. The charting is so limited that almost every Finviz user opens a second platform to actually analyze the stocks they find. And at $299.50/year, Finviz Elite competes with platforms that offer meaningfully more for the same money or less.
ChartingLens is the best overall Finviz alternative because it replaces the entire multi-tab workflow. AI-powered screening via CL Score and buy/sell signals replaces Finviz's manual screener. The fundamentals panel — income statements, balance sheets, analyst targets, insider data, superinvestor tracking — replaces the snapshot page and then some. Real-time charting with AI-drawn support/resistance, automated pattern recognition, and plain-English backtesting replaces whatever charting platform you were using alongside Finviz. And it is free, with premium at $9.99/mo.
If you depend on the heat map specifically, TradingView is the answer. If you want the same data-dense table approach with broader asset coverage, Barchart is the step up. But for most traders who use Finviz for screening, fundamentals, and trade discovery, ChartingLens covers it better, in one place, with AI doing the work the screener filters used to do manually.
Try ChartingLens Free
AI screening, company fundamentals, insider data, superinvestor tracking, and real-time charts. No credit card. No subscription required to start.
Try ChartingLens Free