The Technical vs Fundamental Divide
There is a persistent divide in the stock analysis platform market: tools that are excellent at technical charting and tools that are excellent at fundamental data. Very few do both well, and traders have been forced to keep multiple tabs open for years because of it.
On the technical side, TradingView dominates. It has the deepest indicator library, the most polished charting interface, and a massive community of shared scripts. If your workflow is primarily chart-based — drawing trend lines, configuring RSI and MACD, backtesting Pine Script strategies — TradingView is the undisputed leader. But its fundamental data is shallow. You get basic income statements and key ratios, but nothing approaching the depth of a dedicated fundamental platform.
On the fundamental side, Koyfin and TIKR are the standouts for financial data visualization. Koyfin offers beautiful dashboards where you can compare company financials side by side, chart valuation metrics over time, and track earnings revisions. TIKR goes deep on historical data — 10+ years of financial statements with global stock coverage. Both are excellent for value investors doing company research. But neither has meaningful technical charting tools.
Finviz has the best screener in the business — fast, visual, with dozens of fundamental and technical filters plus the iconic heat map. Morningstar has the deepest fundamental research — fair value estimates, economic moat ratings, and stewardship grades that no other platform replicates. Stock Rover bridges fundamentals and portfolio analytics with excellent screening and research reports. Each is outstanding in its niche.
But traders increasingly need both technical and fundamental analysis — and ideally AI on top. Swing traders use charts for entries but fundamentals for stock selection. Position traders want technical confirmation on fundamentally sound stocks. The "pick one or the other" model is breaking down. This comparison evaluates every platform across both dimensions, because the best stock analysis platform in 2026 should not force you to choose.
What I Compared
I evaluated each platform across eight dimensions that matter for traders and investors who want comprehensive analysis coverage:
- Technical charting: Chart types (candlestick, line, Heikin Ashi, etc.), number of indicators, drawing tools, multi-timeframe support, multi-chart layouts, and real-time data quality.
- Fundamental data: Financial statements (income, balance sheet, cash flow), analyst estimates and price targets, earnings data, valuation metrics, and historical data depth.
- Screening: Number of filters, speed, fundamental and technical filter coverage, and how actionable the results are.
- AI features: AI-generated signals, automated pattern recognition, AI assistants, natural-language backtesting, or any form of machine-learning analysis.
- Insider and institutional data: SEC filing tracking, institutional ownership, superinvestor portfolios, and options flow visibility.
- Alerting: Price alerts, technical condition alerts, fundamental event alerts, and delivery methods.
- Price: Free tier viability, paid tier cost, and what you actually get at each level.
- Both TA + FA? Whether the platform genuinely covers both technical and fundamental analysis, or only one side.
Every platform on this list I have used personally for real trading analysis. I trade daily and I build trading software — I know what matters in practice, not just on feature lists.
Comparison Table
| Platform | Price | Technical Analysis | Fundamental Data | AI Features | Screener | Insider Data | Both TA+FA? |
|---|---|---|---|---|---|---|---|
| ChartingLens | $0-9.99/mo | 15+ indicators, 9 chart types | Full panel + financials | AI signals + assistant | AI-powered | SEC filings + superinvestors | Yes |
| TradingView | $0-59.95/mo | 100+ indicators, Pine Script | Basic financials | No | Advanced | No | TA only |
| Koyfin | $0-65/mo | Basic charting | Excellent dashboards | No | Good | No | FA only |
| Stock Rover | $7.99-27.99/mo | No real charting | Excellent + portfolio | No | Excellent | Basic | FA only |
| TIKR | $0-29.99/mo | None | Deep, 10yr+ global | No | Basic | No | FA only |
| Finviz | $0-39.50/mo | Static charts | Snapshot metrics | No | Legendary | Summary | Screener-first |
| Morningstar | ~$35/mo | None | Deepest research | No | Fund-focused | No | FA only |
The 7 Platforms
1. ChartingLens — Best All-in-One Technical & Fundamental Analysis Platform
ChartingLens is the only platform on this list that genuinely does both technical and fundamental analysis well, with AI and insider data on top. That is not a marketing claim — it is a structural observation about the market. TradingView does not have deep fundamentals. Koyfin does not have real charting. TIKR and Morningstar have zero TA tools. Stock Rover has no charting platform. Finviz has static images. ChartingLens is the one that covers both sides in a single interface.
On the technical analysis side: 15+ configurable indicators including SMA, EMA, MACD, RSI, Bollinger Bands, Ichimoku Cloud, VWAP, Volume Profile, Stochastic, ATR, OBV, and more. Nine chart types including candlestick, Heikin Ashi, line, area, bar, hollow candle, baseline, Renko, and Kagi. Fourteen-plus drawing tools — trend lines, horizontal rays, Fibonacci retracements, parallel channels, rectangles, text annotations — all synced to the cloud. Multi-chart layouts, timeframes from 1 minute to monthly, pre-market and after-hours data. It will not match TradingView's 100+ indicator library or Pine Script ecosystem, but for the vast majority of technical workflows, the coverage is more than sufficient.
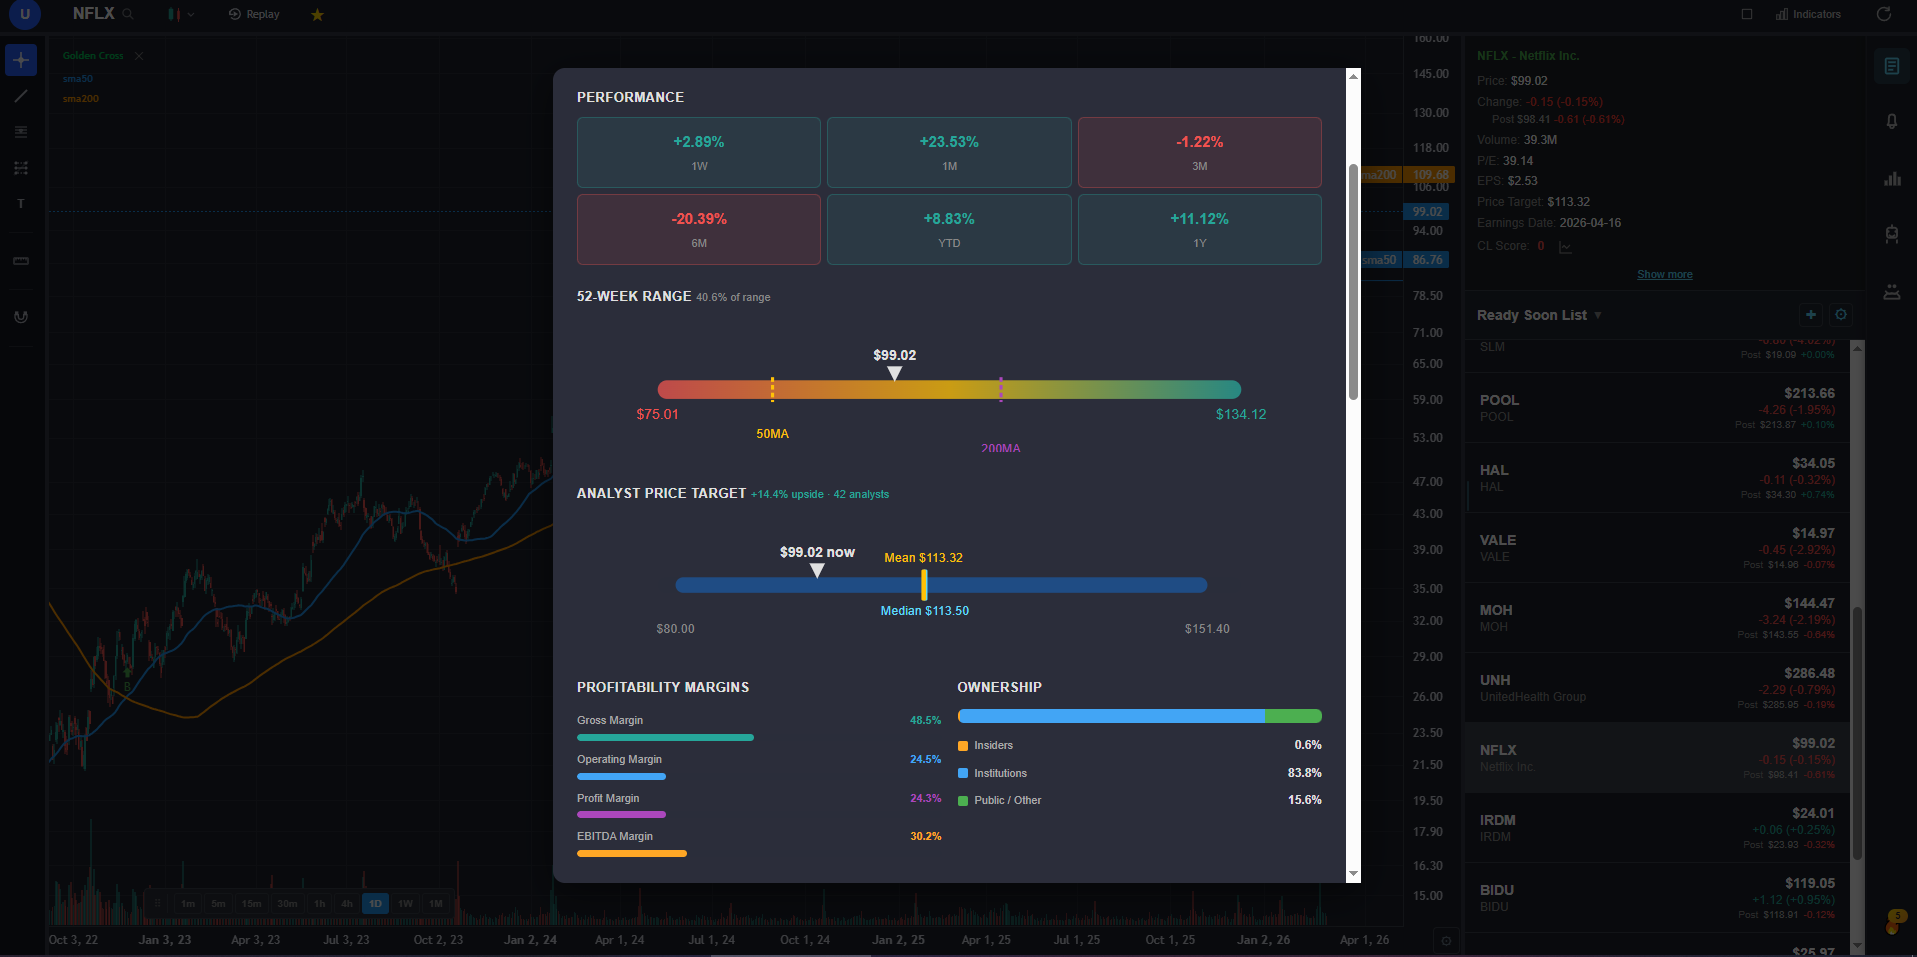
On the fundamental analysis side: a full company fundamentals panel with P/E ratio, EPS, dividend yield, analyst price targets, earnings dates and history, income statement, balance sheet, and cash flow data. You can pull up any stock and see the fundamental picture alongside your chart without switching tabs or platforms. It will not match Koyfin's custom dashboard depth or TIKR's 10-year global financial data, but for checking fundamentals while you chart, it is the most efficient workflow available.
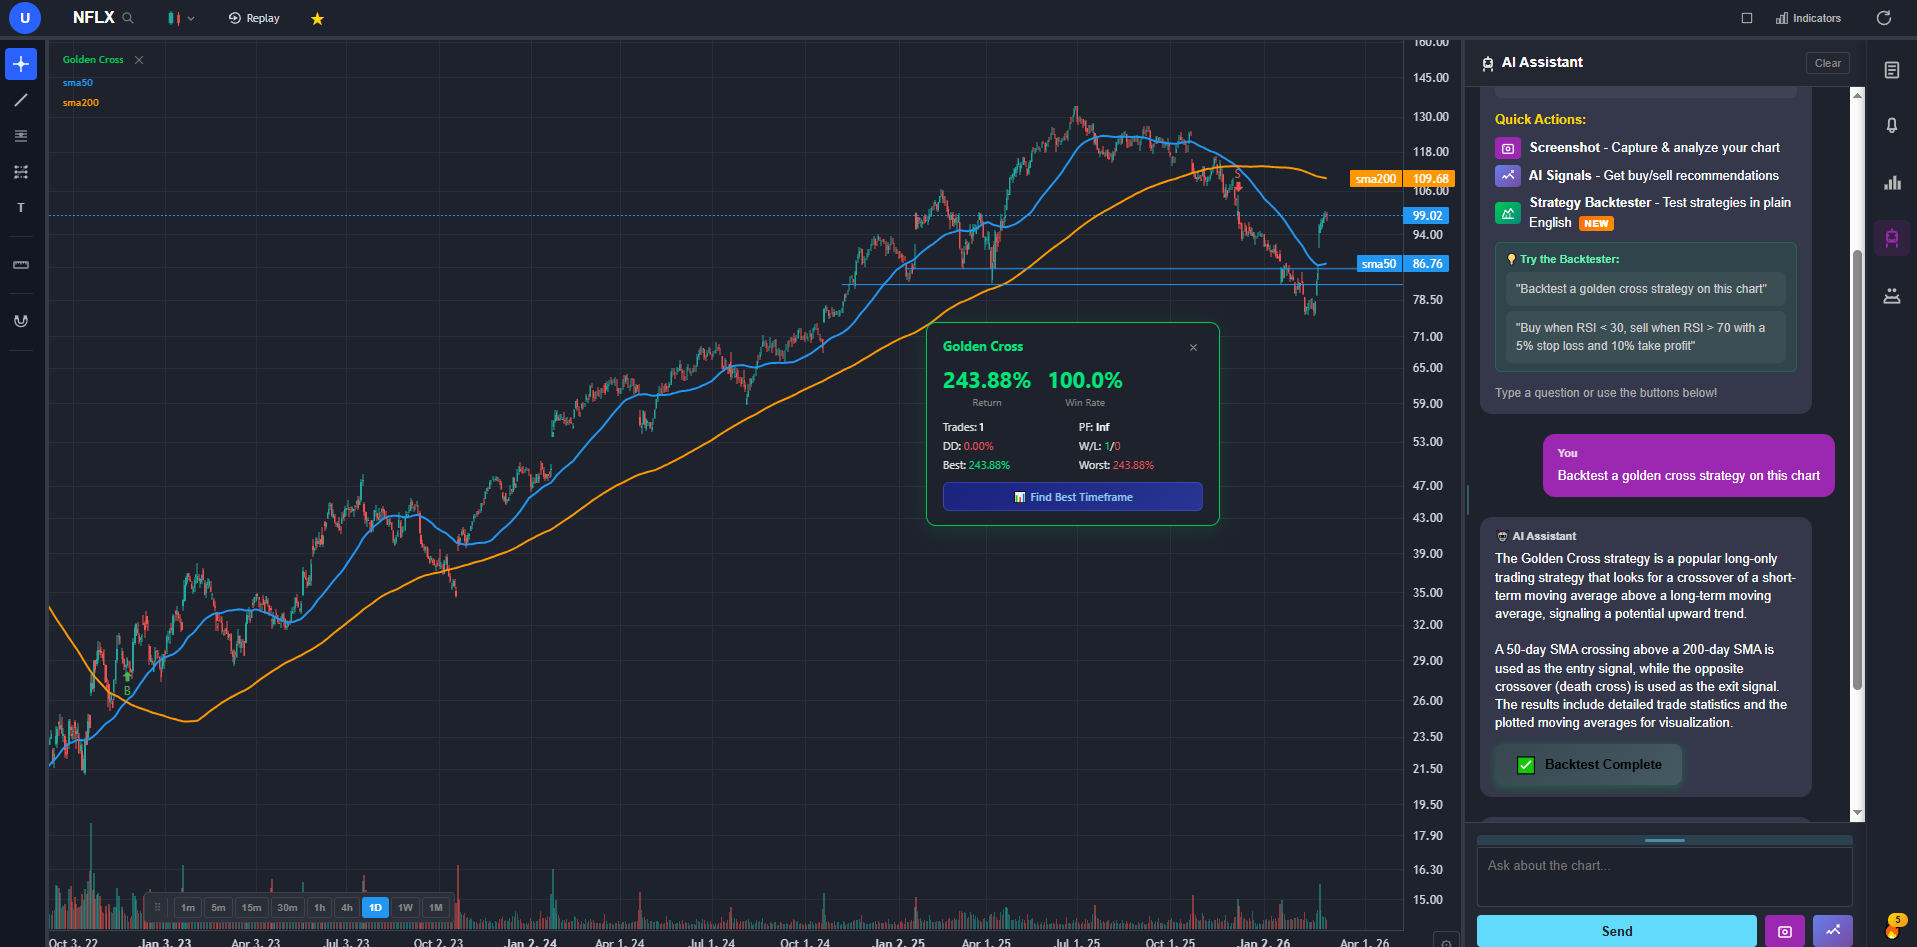
Where it goes beyond both: AI buy/sell signals scan 2,000+ stocks daily with 25 signals per day. A plain-English strategy backtester lets you describe any strategy in natural language and get full performance results — return, Sharpe ratio, win rate, max drawdown. Automated chart pattern recognition identifies formations directly on your chart. An AI trading assistant that knows your current chart context can answer questions, draw support and resistance, and explain setups. Insider cluster detection tracks SEC filings to surface stocks where multiple insiders are buying. A superinvestor tracker shows what top hedge fund managers are accumulating.
The free tier includes the full analysis feature set. Premium at $9.99/mo adds higher signal limits and advanced features. No credit card required to start. This is the platform where you can see a chart, check fundamentals, run an AI scan, and check insider buying — without switching platforms.
2. TradingView — Best-in-Class Technical Charting
TradingView is the charting king. There is no way around it. Over 100 built-in indicators, a massive library of community-created indicators and strategies via Pine Script, the most polished web-based chart interface on the market, and a social layer where millions of traders share ideas. If your primary workflow is technical analysis — drawing on charts, configuring complex indicator setups, building and testing custom scripts — TradingView has the deepest feature set available. The chart rendering is smooth, the indicator customization is granular, and the community ecosystem means someone has probably already built and shared whatever niche indicator you need.
But fundamental data is where TradingView falls short. You get basic financial statements — income, balance sheet, cash flow — and key ratios on stock pages. But there are no custom fundamental dashboards, no analyst consensus history, no deep earnings visualization, and no way to compare companies side by side on financial metrics the way Koyfin or TIKR allow. There are no insider trading data, no superinvestor tracking, no AI signals, and no automated pattern recognition. TradingView is not trying to be a fundamental analysis platform — it is a charting platform, and it is the best one.
The free tier limits you to one indicator per chart — which effectively forces a paid subscription for any real technical work. The Plus plan at $29.95/month gets five indicators per chart. Premium at $59.95/month removes most limits. For pure technical analysts who do not need deep fundamentals, TradingView is the obvious choice. For traders who need both TA and FA in one place, ChartingLens covers both sides at a fraction of the cost.
3. Koyfin — Best Fundamental Data Dashboards
Koyfin is what happens when a team builds a Bloomberg Terminal for retail investors. The financial dashboards are genuinely excellent — you can chart revenue growth vs. operating margins over time, compare P/E ratios across a peer group, visualize earnings revisions, track sector performance, and build custom views that pull together exactly the fundamental data you care about. For institutional-style fundamental research at a retail price point, Koyfin's data visualization is among the best available. The screening capabilities are solid, with fundamental filters that cover most metrics serious investors use.
The limitation is on the technical analysis side. Koyfin has charts, but they are designed for plotting financial data, not for active trading. The indicator library is limited, there are no drawing tools for trend lines or Fibonacci retracements, and the charting experience does not support the kind of multi-timeframe, indicator-heavy workflow that technical traders need. There are no AI features, no insider trading data from SEC filings, and no backtesting capability.
Koyfin's free tier has been progressively restricted — core features that were once free now require the Plus plan at $35/month or the Pro plan at $65/month. For fundamental analysts and institutional researchers who need Bloomberg-style dashboards, Koyfin delivers. For traders who also need technical charting, AI, and insider data, ChartingLens covers both fundamental and technical analysis in one place. See my full Koyfin alternatives breakdown for a detailed comparison.
4. TIKR — Deepest Financial Data for Global Stock Research
TIKR is built for one thing: deep fundamental research on individual companies. It does this exceptionally well. Financial statements going back 10+ years, clean formatting, global stock coverage that includes international markets most platforms ignore, analyst estimates with historical tracking, and a user interface that makes reading financial data genuinely pleasant. For value investors who spend hours digging into a single company's financials before making a decision, TIKR provides the deepest and most organized data set available at a retail price.
The tradeoff is absolute: TIKR has zero technical analysis capability. No charts, no indicators, no drawing tools, no price-based analysis of any kind. It is purely a financial data platform. There are no AI features, no insider trading data, no screener beyond basic filtering, and no alerting system. If you need to see a stock chart alongside your financial data, you will need a second platform.
The free tier gives access to basic financial data. The Plus plan at $19.99/month and Pro at $29.99/month unlock deeper history and more features. TIKR is outstanding for its specific purpose. For traders who also need technical charting and AI alongside their fundamental research, ChartingLens provides both the fundamental data panel and the full charting experience that TIKR lacks.
5. Stock Rover — Best Fundamental Screening & Portfolio Analytics
Stock Rover occupies a unique position in this comparison: it is the best platform for combining fundamental screening with portfolio analytics and research reports. The screener is deep — hundreds of fundamental metrics, pre-built screening strategies (Buffett, Graham, O'Shaughnessy), customizable scoring models, and the ability to save and refine screens over time. The research reports generate automated analysis with fair value estimates, growth scores, and financial health ratings. Portfolio analytics show performance attribution, risk metrics, and diversification analysis alongside your holdings.
Stock Rover does not have a real charting platform. You can see basic price charts on stock pages, but there are no technical indicators to configure, no drawing tools, no multi-timeframe analysis, and no real-time candlestick charts. It is a purely fundamental tool with an emphasis on screening and portfolio management. There are no AI features and no insider data tracking beyond basic ownership metrics.
Pricing starts at $7.99/month for Essentials and goes to $27.99/month for Premium, which unlocks the full screening and reporting feature set. For long-term investors focused on fundamental screening and portfolio management, Stock Rover is outstanding. For traders who also need technical analysis and AI, pair it with ChartingLens for the charting, signals, and insider data that Stock Rover does not provide.
6. Finviz — Legendary Screener & Heat Maps
Finviz's stock screener is legendary for good reason. It is fast, visual, and covers an enormous range of fundamental and technical filters — P/E, PEG, debt/equity, revenue growth, RSI, moving averages, float short, insider transactions, and dozens more. The results display as a sortable table with mini charts, or as the iconic heat map that shows sector and industry performance at a glance. For quickly scanning the market and filtering stocks by a combination of fundamental and technical criteria, nothing is faster than Finviz. The stock snapshot pages include key financial metrics, analyst recommendations, and insider trading summaries — enough for a quick fundamental check.
The limitation is in charting depth. Finviz charts are static images — you cannot add indicators, draw on them, or interact with price data in real time. The free tier uses delayed data. Elite at $39.50/month adds real-time quotes, intraday charts, advanced screening, and premarket data. There are no AI features and no backtesting. Finviz is a screener-first platform that does screening better than anyone, but it is not an analysis platform in the way TradingView or ChartingLens are. Use it for screening, then analyze in a platform with real charting and fundamentals.
7. Morningstar — Deepest Fundamental Research & Fair Value
Morningstar has the deepest fundamental research of any platform on this list. The analyst team publishes detailed research reports with fair value estimates based on discounted cash flow models, economic moat ratings (wide, narrow, none) that assess a company's competitive advantages, stewardship grades for management quality, and uncertainty ratings. For buy-and-hold investors who want to understand a company's intrinsic value and long-term competitive position, Morningstar's research is the gold standard. The fund research is equally strong — Morningstar ratings on mutual funds and ETFs are the most widely referenced in the industry.
Morningstar has zero technical analysis capability. No interactive charts, no indicators, no drawing tools, no price-based analysis. It is a purely fundamental, research-driven platform built for investors who make decisions based on intrinsic value, not chart patterns. There are no AI features, no insider trading data, no real-time data, and the screener is focused on funds rather than individual stock technical criteria.
Morningstar Investor costs approximately $35/month and unlocks the full research library, fair value estimates, and portfolio analysis. For investors who buy and hold based on fundamental quality and fair value, Morningstar is irreplaceable. For traders who also need charts and technical tools, combine it with a charting platform like ChartingLens to get both the deep research and the real-time analysis that Morningstar does not offer.
Who Needs Both TA and FA?
The need for both technical and fundamental analysis is not theoretical — it is driven by real trading workflows that millions of traders use daily:
- Swing traders who use fundamental screening to find quality stocks (strong earnings, growing revenue, insider buying) and then use technical charting to time their entries and exits with indicators and support/resistance levels.
- Position traders who want fundamentally sound stocks (good P/E, strong balance sheet, analyst upgrades) but wait for technical confirmation — a breakout above resistance, a bullish MACD crossover, or a volume surge — before committing capital.
- Growth investors who track earnings reports and revenue growth on the fundamental side, then use charts to identify whether the stock has already priced in the growth or offers a reasonable technical entry point.
- Anyone tired of the multi-tab workflow. Having TradingView open for charts, Koyfin or TIKR open for fundamentals, Finviz open for screening, and maybe Morningstar open for fair value — that is four tabs and four subscriptions to do what one comprehensive platform should handle.
The "multi-tab workflow" is a genuine pain point. Every time you switch platforms, you lose context. You see a stock on the screener, open a new tab for the chart, open another for financials, maybe a fourth for insider data. By the time you have assembled the full picture, the setup has moved. A platform that puts charting, fundamentals, AI signals, and insider data in a single interface is not just more convenient — it is a faster, more effective way to analyze stocks.
My Final Verdict
Here is what this comparison comes down to: most stock analysis platforms in 2026 are still excellent at one thing and absent on the other. The divide between technical and fundamental platforms persists. Your best choice depends on your primary need, but also on whether you are willing to live with that divide or want a platform that bridges it.
- If you need the absolute best technical charting: TradingView. The indicator library, Pine Script ecosystem, and community are unmatched. Accept that fundamental data will be shallow.
- If you need beautiful fundamental dashboards: Koyfin. The financial data visualization is institutional-grade. Accept that charting will be basic.
- If you need deep financial data on global stocks: TIKR. Ten-plus years of clean financial data with international coverage. Accept that you will need a separate charting tool entirely.
- If you need fundamental screening and portfolio analytics: Stock Rover. The screener depth and research reports are excellent. Accept that there is no real charting platform.
- If you need fast visual screening: Finviz. The screener and heat maps are the fastest in the business. Accept that analysis will happen elsewhere.
- If you need the deepest fundamental research: Morningstar. Fair value estimates, moat ratings, and analyst reports are the gold standard. Accept zero TA capability.
- If you need both technical and fundamental analysis, plus AI: ChartingLens. It is the only platform on this list where you get real technical charting, a full fundamentals panel, AI signals, insider data, and a screener in a single interface. It will not match the specialized depth of TradingView's indicator library or Koyfin's dashboard customization, but it covers both sides competently — and adds AI and insider data that none of the specialized platforms offer.
Most traders should pick the platform that covers their primary need plus their secondary need, rather than being great at one and completely absent on the other. If you analyze with both charts and fundamentals — and most serious traders do — start with the platform that handles both, then supplement with specialized tools if you need more depth in one area.
The All-in-One Analysis Platform
Technical charting, fundamental data, AI signals, insider tracking, and screening — one platform, one price. No credit card to start.
Start Analyzing Free