What "Stock Analysis" Actually Means in 2026
The phrase "stock analysis" used to mean one of two things: you either looked at charts (technical analysis) or you read financial statements (fundamental analysis). Pick your camp. The technicals crowd thought the fundamentals crowd was too slow. The fundamentals crowd thought the technicals crowd was reading tea leaves. Both sides were partially right and partially wrong.
In 2026, that split is outdated. The best stock analysis platform is not a charting tool or a research terminal — it is both, and more. A genuine stock analysis platform today needs to combine technical charting with real-time fundamental data, AI-powered screening that surfaces opportunities across thousands of stocks, insider and institutional ownership data, and alerting that ties it all together. Most platforms still only do one or two of these well. They are charting platforms pretending to do fundamentals, or research terminals with charts bolted on as an afterthought.
The reason this matters is practical. If you use TradingView for charts and Seeking Alpha for fundamentals and Finviz for screening, you are paying for three subscriptions, switching between three tabs, and mentally stitching together three different data sources every time you evaluate a stock. That workflow made sense when no single platform could do it all. In 2026, there are platforms that can — and the best stock market tools are the ones that save you from that juggling act while keeping the depth that each specialized tool provides.
I have been building trading tools for several years and I actively trade. I have used every platform on this list as part of my own research workflow, not just for a weekend trial. This is a comparison of the best stock research platforms for investors and traders based on real use — what works, what is overpriced, and what is genuinely worth your money.
How I Evaluated These Platforms
Not every trader cares about the same things, but these are the dimensions that matter most when choosing stock analysis software in 2026. I weighted each platform across all of them.
- Technical analysis depth. How good are the charts? How many indicators are available? Can you draw trendlines, Fibonacci levels, and support/resistance zones? Are charts interactive and real-time, or static images? A best stock analysis platform needs professional-grade charting as a baseline.
- Fundamental data quality. Can you pull up income statements, balance sheets, cash flow statements? Are analyst price targets available? What about profitability margins, valuation ratios, earnings history? The best stock research platform for investors needs to surface this data cleanly without requiring you to dig through SEC filings manually.
- Screening power. Can you filter the entire market by technical and fundamental criteria simultaneously? How fast is the screener? Does it offer a stock scoring system tool or proprietary rating? The best paid stock screener does not just filter — it ranks.
- AI capabilities. Does the platform use machine learning to scan for setups you would miss manually? Are there AI buy/sell signals with confidence scores? Can you backtest strategies in plain English? Automated stock scanning software powered by genuine AI is the single biggest differentiator in 2026.
- Insider and institutional data. Can you see what company insiders are buying and selling? What about superinvestor portfolios — the 13F filings of managers like Buffett, Burry, and Ackman? Insider cluster detection? This data layer is increasingly important and most platforms ignore it entirely.
- Alerting. Can you set price alerts, technical alerts, or fundamental threshold alerts? Do alerts work across mobile and desktop? Alerting turns analysis into action.
- Price. Stock analysis software pricing varies wildly — from free to hundreds per month. I evaluated value relative to what you get, not just the sticker price.
- Learning curve. A platform can have every feature in the world, but if it takes six months to learn, it is not the best stock analysis tool for beginners. Approachability matters.
Quick Comparison Table
| Platform | Price | Technical Analysis | Fundamentals | AI Features | Insider Data | Screener |
|---|---|---|---|---|---|---|
| ChartingLens | $0 – $9.99/mo | 15+ indicators, drawing tools | Full financials, analyst targets | AI signals, backtester, assistant | Insider + superinvestors | CL Score + filters |
| Finviz | $0 – $39.50/mo | Static charts only | Basic snapshot | None | Basic insider page | Excellent filters |
| TradingView | $0 – $59.95/mo | Best-in-class charting | Thin financials | Community scripts only | None | Basic screener |
| Seeking Alpha | $0 – $299/yr | No charting/TA | Deep research, Quant Ratings | Quant model only | Limited | Rating-based filter |
| Koyfin | $0 – $65/mo | Basic charts | Excellent dashboards | None | None | Financial filters |
| Yahoo Finance Premium | $25/mo | Basic interactive | Basic financials | None | Basic insider page | Basic screener |
The 6 Best Stock Analysis Platforms
1. ChartingLens — Best All-in-One Stock Analysis Platform
ChartingLens is the platform I built, and I acknowledge the bias upfront. But here is what makes it the best stock analysis platform in 2026: it is the only tool I have found that genuinely does everything — professional charting, company fundamentals, AI-powered signals, insider data, superinvestor tracking, stock screening, and backtesting — in a single interface, at a price that does not require a second mortgage.
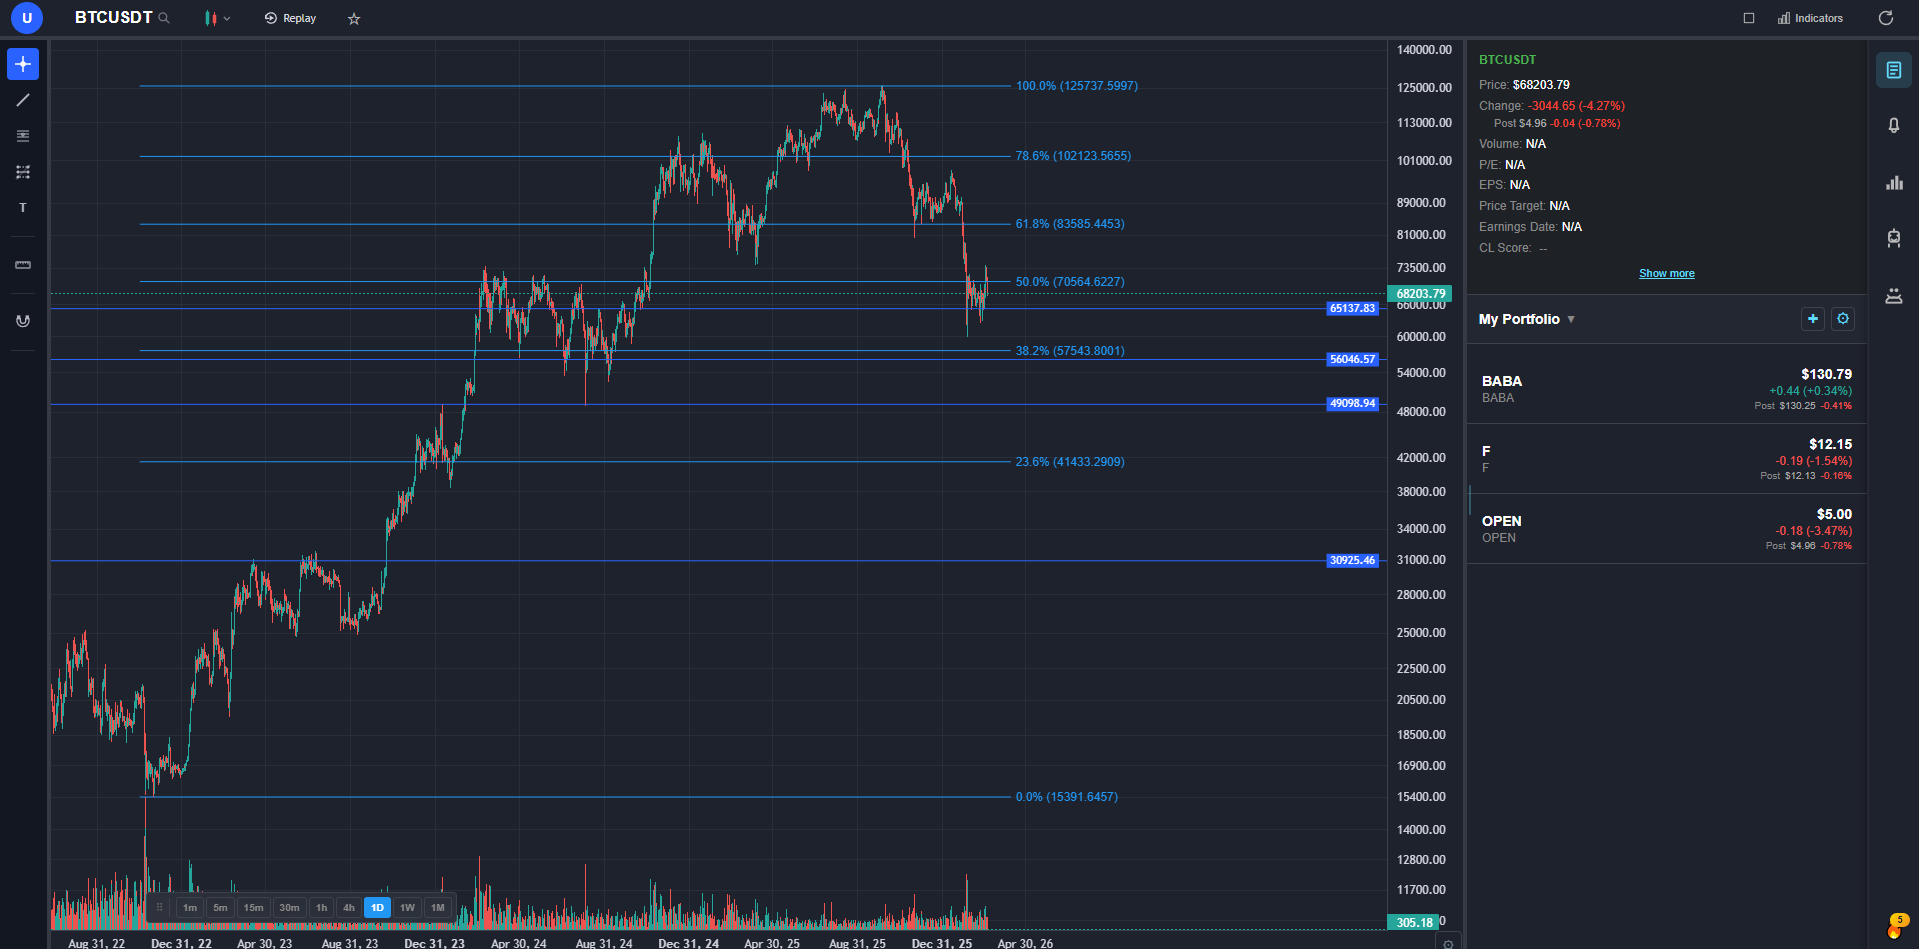
The charting engine gives you 15+ technical indicators (RSI, MACD, Bollinger Bands, Stochastic, Volume Profile, and more) plus a full set of drawing tools — trendlines, Fibonacci retracements, horizontal levels, channels. These are real interactive charts, not static images. You can overlay multiple indicators, switch timeframes, and annotate directly on the chart.
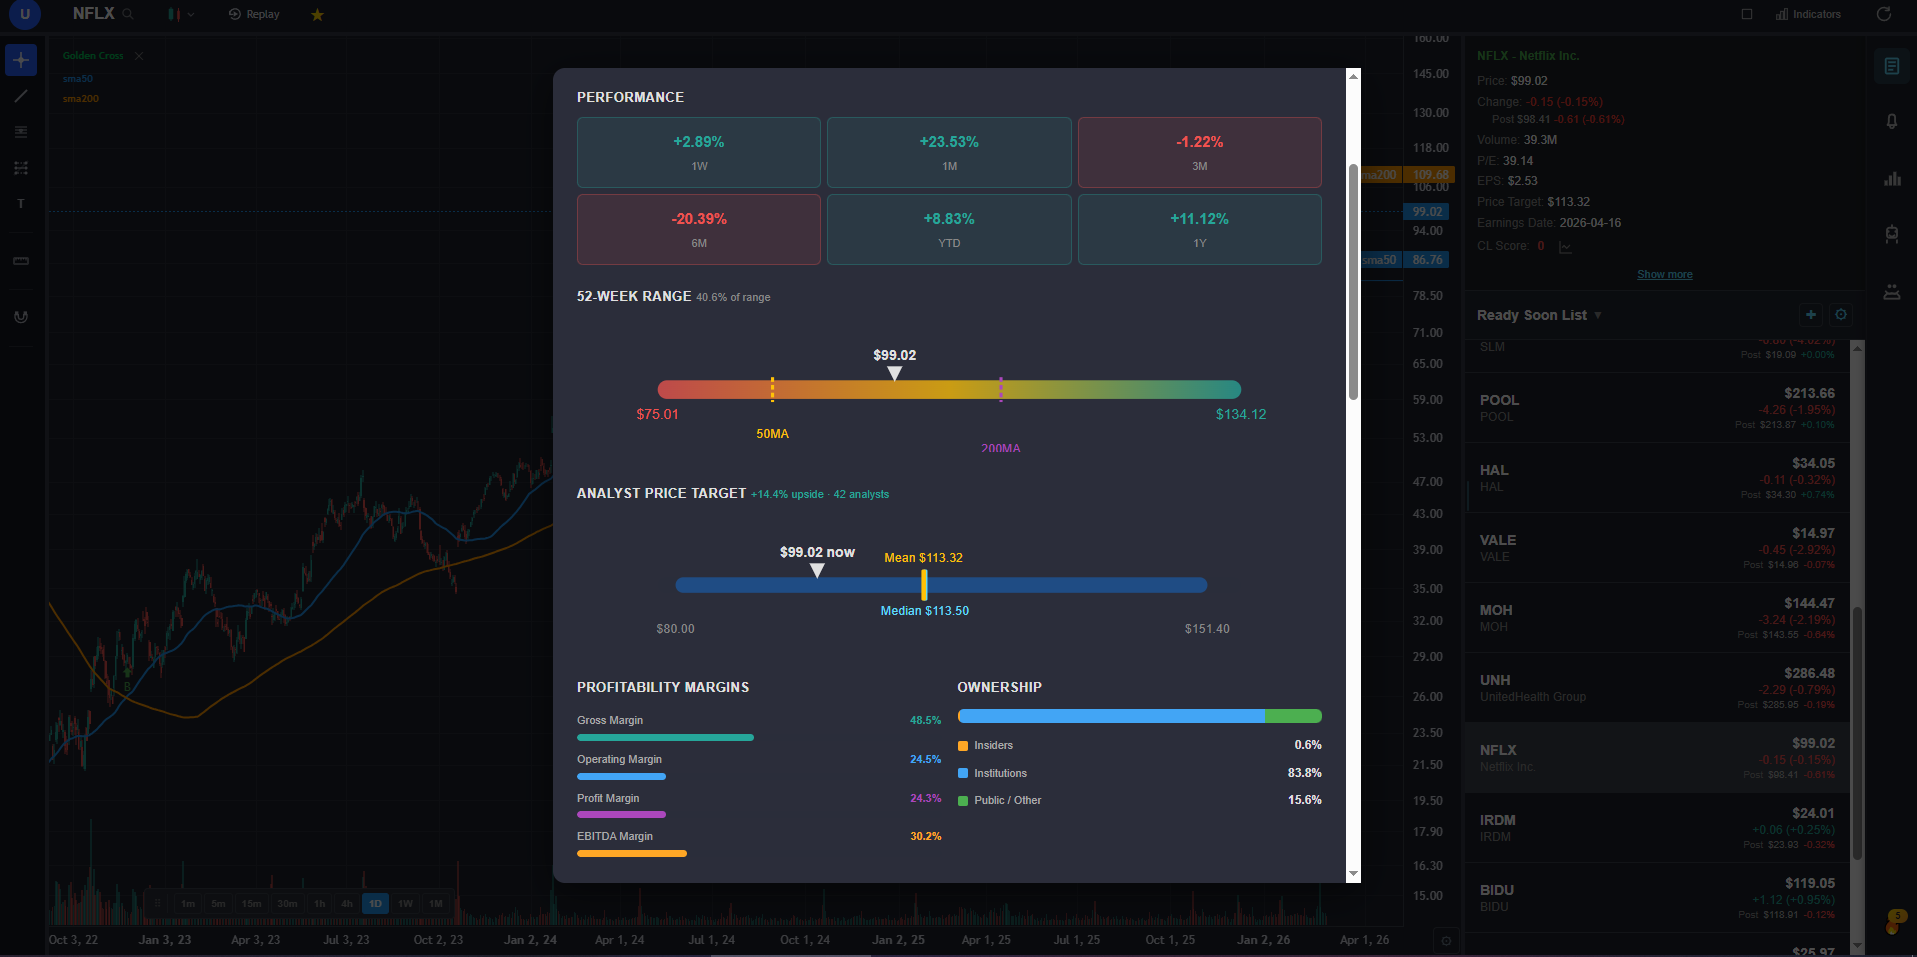
The fundamentals panel surfaces the data that matters for stock research without burying you in noise. Pull up any ticker and you get P/E ratio, EPS, analyst consensus price targets, revenue and earnings history, profitability margins, balance sheet data, and institutional ownership percentages. This is the fundamental and technical analysis tool combination that most platforms fail to deliver — they do one or the other, not both integrated into the same workflow.
AI buy signals scan over 2,000 stocks daily using machine learning models trained on price patterns, volume dynamics, and technical indicator confluences. Each signal comes with a confidence score, entry price, target price, and stop-loss. The CL Score — ChartingLens's proprietary stock scoring system tool — aggregates multiple factors into a single quality rating that makes it simple to compare opportunities at a glance. This is automated stock scanning software that actually gives you actionable output, not just a filtered list of tickers.
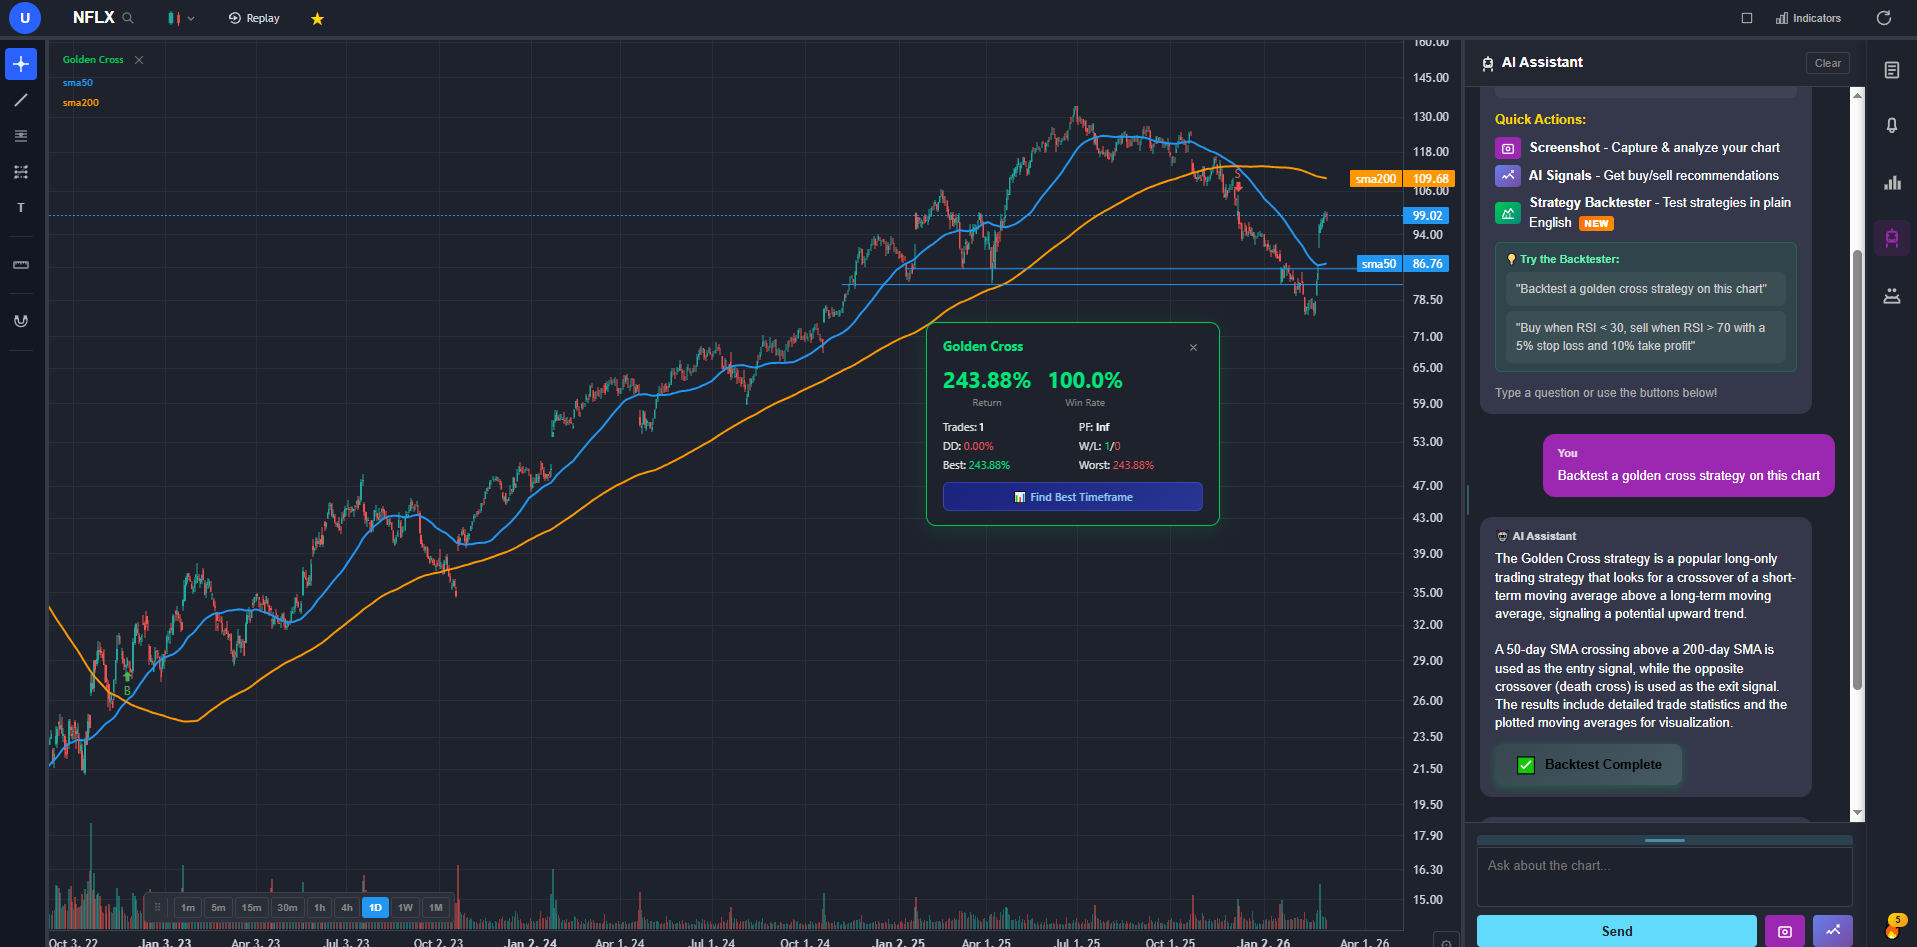
The plain-English backtester is one of the features I am most proud of. Type something like "test buying when RSI drops below 30 and selling when it crosses above 70 on AAPL over the last 5 years" and you get a full performance report — total return, win rate, drawdown, trade-by-trade history — with zero coding required. Most backtesting tools require Pine Script, Python, or some proprietary language. ChartingLens lets you test ideas in seconds using natural language.
The insider trading tracker pulls data from SEC filings and surfaces insider buys and sells with cluster detection — identifying when multiple insiders at the same company are buying within a short window, which is historically one of the strongest signals in the market. The superinvestor tracking lets you follow the 13F portfolio changes of managers like Buffett, Burry, Ackman, and dozens of others. See what they are buying, selling, and how their positions have changed over time.
The stock screener combines fundamental and technical filters with the CL Score rating system. Filter by P/E, market cap, sector, EPS growth, RSI, volume, and more — then sort by the CL Score to surface the highest-rated opportunities. It is the best paid stock screener at this price point because it integrates screening with the rest of the analysis workflow instead of existing as a separate tool.
Where ChartingLens falls short: The platform is focused on U.S. equities and crypto. If you need deep international market coverage, commodities, or forex analysis, you will need to supplement with another tool. The community is growing but smaller than TradingView's massive user base, so you will not find thousands of shared indicators and scripts. And while 15+ indicators covers the vast majority of trading approaches, power users who want 200+ obscure indicators may find TradingView's library deeper.
All of this — charting, fundamentals, AI signals, backtesting, insider data, superinvestor tracking, screening, and the CL Score — is available for $9.99/mo. The free tier covers core charting and limited access to most features so you can evaluate the platform before committing. For stock analysis software pricing, nothing else comes close to this value.
2. Finviz — Best Pure Stock Screener
Finviz has been the default stock screener for retail traders for nearly two decades, and for good reason. The screener is fast, the filter options are extensive, and the heat map is iconic — a single visual that shows you the entire market's performance by sector, market cap, or custom criteria. If screening is your primary workflow, Finviz is hard to beat for sheer filtering speed and layout clarity.
The snapshot pages for individual stocks give you a quick fundamental overview — P/E, market cap, analyst ratings, insider ownership percentages. Elite ($39.50/month) adds real-time data, premarket/aftermarket screener access, advanced charting, backtesting, and correlation analysis. For traders who live in screener-first workflows and just need to quickly filter the market by dozens of criteria, Finviz delivers.
Where Finviz falls short: The charting is the biggest weakness. Charts are static images — you cannot draw on them, overlay indicators interactively, or do any real technical analysis work. The free tier uses delayed data (20 minutes), which limits real-time decision making. There are no AI features, no machine learning signals, no plain-English backtesting, and no superinvestor tracking. The fundamental data is a snapshot, not a deep research terminal. Finviz is a screening tool, not a stock analysis platform — and in 2026, that distinction matters.
If you pair Finviz with a charting platform and a research service, you can build a solid workflow — but you are now paying for three tools. ChartingLens rolls screening, charting, and research into one platform at a lower cost than Finviz Elite alone.
3. TradingView — Best Pure Charting Platform
TradingView is the undisputed king of charting. The chart engine is beautiful, responsive, and loaded with hundreds of built-in indicators. Pine Script lets you write custom indicators and strategies. The community has published over 100,000 custom scripts and indicators. Multi-chart layouts, multi-timeframe analysis, replay mode, and drawing tools are all best-in-class. If your analysis is primarily technical — candlestick patterns, trendlines, oscillators, volume analysis — TradingView is the gold standard.
The social component is a genuine differentiator. Published ideas, community discussions, and the ability to follow other traders create a learning ecosystem that no other platform matches. For newer traders trying to understand how experienced analysts read charts, the community alone justifies using TradingView.
Where TradingView falls short: Fundamentals are thin. You can pull up basic financial data, but it is nowhere near the depth of Seeking Alpha, Koyfin, or even ChartingLens. There is no insider trading data, no superinvestor portfolio tracking, and no native AI buy/sell signals. The "AI" features are community-contributed Pine Script indicators, not machine learning models scanning the market. The screener exists but is basic compared to Finviz or ChartingLens's CL Score system. And pricing escalates quickly — the Premium plan at $59.95/month adds up to $719/year for what is primarily a charting tool.
TradingView is exceptional at what it does. But it does one thing — charting. If you need a complete stock analysis platform that also covers fundamentals, AI signals, and insider data, you will need to pair TradingView with additional tools.
4. Seeking Alpha — Best Fundamental Research Platform
Seeking Alpha is the strongest fundamental research platform available to retail investors. The Quant Ratings system grades stocks on valuation, growth, profitability, momentum, and EPS revisions — creating a systematic, quantitative scoring framework that removes much of the guesswork from fundamental analysis. Analyst estimates, earnings call transcripts, dividend tracking, and the crowdsourced analyst community create a research depth that is hard to match anywhere else at this price.
The earnings coverage is particularly strong. Pre-earnings analysis, real-time earnings call transcripts, post-earnings reaction analysis, and EPS revision tracking give you a complete picture of the fundamental story around any stock. For value investors and fundamental analysts, Seeking Alpha is the go-to platform.
Where Seeking Alpha falls short: There is zero charting or technical analysis capability. None. No candlestick charts, no indicators, no drawing tools, no technical screener. If you do any technical analysis at all, you need a separate platform. There is no AI signal generation, no backtesting, and no insider cluster detection. The screener is based on Quant Ratings and fundamental filters, but it cannot combine technical and fundamental criteria the way ChartingLens can.
Seeking Alpha is excellent at what it does — fundamental research — but it is half a stock analysis platform. Pairing it with TradingView or ChartingLens fills the technical gap, though that means managing two subscriptions.
5. Koyfin — Best Financial Data Dashboards
Koyfin is the closest thing retail investors have to a Bloomberg Terminal without the Bloomberg price tag. The financial data dashboards are excellent — you can build custom views comparing revenue growth across competitors, overlay valuation multiples over time, track sector performance, and visualize financial statements in ways that make trends immediately obvious. The data presentation is clean, professional, and highly customizable.
The screener filters by fundamental criteria with depth that rivals more expensive institutional tools. You can screen by growth rates, margins, valuation multiples, and custom financial ratios. The watchlist and portfolio analysis features are solid, and the comparison tools make it easy to evaluate a stock against its peers on any financial metric.
Where Koyfin falls short: Technical charting is basic — it is a financial data platform, not a charting platform. There are no AI features, no machine learning signals, no automated scanning. Insider trading data is absent, and there is no superinvestor tracking. The Plus plan at $27/month and Pro at $65/month are reasonable for institutional-style data, but you are paying for financial dashboards only — no charting, no AI, no insider data.
Koyfin is the best stock research platform for investors who think in financial models and peer comparisons. But it requires a separate charting platform and offers no AI-driven analysis. ChartingLens covers fundamentals plus charting plus AI for less than Koyfin's free-to-Plus jump.
6. Yahoo Finance Premium — Best Budget Entry Point
Yahoo Finance is where most investors start, and the Premium tier at $25/month tries to turn that starting point into something more substantive. You get enhanced portfolio tracking, research reports from Argus, fair value estimates, advanced charting (improved but still limited), and some additional screening capabilities beyond the free tier.
The value proposition is straightforward: if you already use Yahoo Finance daily and want a modest upgrade without learning a new platform, Premium gives you more data within the interface you already know. The research reports add a layer of professional analysis, and the fair value estimates help with basic valuation decisions.
Where Yahoo Finance Premium falls short: The analysis tools are shallow compared to purpose-built platforms. The screener is basic — limited filters, no custom criteria, no scoring system. There are no AI features, no machine learning signals, no backtesting. The charting is improved but still cannot compete with TradingView or ChartingLens for technical analysis depth. The fundamental data relies on third-party reports rather than a deep native data layer. At $25/month, you are paying more than ChartingLens's $9.99/mo while getting significantly less functionality.
Yahoo Finance Premium is fine as a small step up from the free tier, but it occupies an awkward middle ground. For $25/month, there are platforms that offer dramatically more analytical power. It is the best stock analysis tool for beginners only in the sense that the interface is familiar — not because the tools are strong.
The "One Platform" Advantage
Here is the math that most traders do not think about until they are already paying for multiple tools. A typical serious trading setup in 2026 might look like this:
- TradingView Essential for charting: $14.95/month
- Finviz Elite for screening: $39.50/month
- Seeking Alpha Premium for fundamentals: ~$25/month ($299/year)
That is roughly $80/month ($960/year) across three platforms, three logins, and three different interfaces that do not talk to each other. You find a stock on Finviz, open it on TradingView to check the chart, then switch to Seeking Alpha to read the fundamentals. Every stock evaluation involves three tabs and manual context-switching.
ChartingLens consolidates that workflow into a single platform for $9.99/mo ($120/year). Pull up a ticker and you see the chart with indicators, the fundamentals panel, the AI signal data, the insider trading history, and the CL Score — all on one screen. The screening, charting, and research happen in the same interface, with the same data layer, and without switching tabs. That is not just a price savings of $840/year — it is a workflow improvement that makes you faster and less likely to miss something important.
The single-platform approach is not perfect. TradingView's charting is still deeper. Seeking Alpha's earnings coverage is still more extensive. Finviz's filter count is still larger. But for 90% of the analysis work that 90% of traders actually do, one well-integrated platform beats three specialized tools that do not communicate with each other.
My Final Verdict
Every platform on this list has genuine strengths. The right choice depends on how you analyze stocks and what you are willing to pay. Here is the honest summary:
- ChartingLens is the best stock analysis platform in 2026 for all-in-one value. If you want charting, fundamentals, AI signals, insider data, superinvestor tracking, screening, and backtesting in one tool for $9.99/mo, nothing else comes close. It is also the best stock analysis tool for beginners because everything is in one place with no steep learning curve.
- Finviz is the best choice if screening is your primary workflow. The heat maps and filter-based screener are still the fastest in the space. But you need a separate charting tool.
- TradingView is the best choice if you live and breathe technical analysis. The charting depth, Pine Script ecosystem, and community are unmatched. But you need separate tools for fundamentals and insider data.
- Seeking Alpha is the best choice if you are a pure fundamental investor. Quant Ratings, earnings transcripts, and the analyst community offer research depth no one else matches. But there is zero charting.
- Koyfin is the best choice for institutional-style financial data dashboards.
- Yahoo Finance Premium is fine for casual investors who want a familiar interface with a modest upgrade.
For most traders and investors reading this, ChartingLens is the starting point. It covers the broadest range of analysis needs at the lowest price. From there, you can decide if any specialized tool adds enough value to justify a second subscription.
Try ChartingLens — The All-in-One Analysis Platform
Charts, fundamentals, AI signals, insider tracking, and screening — all in one place. No credit card required.
Start Analyzing Free