Why Charting Software Matters More Than Ever
There is a massive gap between the free charts you get on financial news sites and what a professional charting platform actually provides. If you have ever tried to do serious technical analysis on a basic web chart — no drawing tools, one or two indicators, delayed data — you know exactly what I mean.
In 2026, the best stock charting software gives you real-time data, dozens of configurable indicators, multi-chart layouts, alerts that fire on price and indicator conditions, and increasingly, AI-powered analysis. The difference between making a trading decision on a basic chart versus a professional one is the difference between guessing and being informed.
The problem is that the market for charting software is crowded and confusing. Some platforms charge $60+/month for features others offer for free. Some look impressive in screenshots but feel clunky in daily use. And most "review" articles are written by people who have never actually traded.
I am a software engineer who trades daily. I have built a charting platform from scratch, which means I understand what goes into rendering a chart, managing real-time data feeds, and implementing indicators at a code level. That perspective shapes this review — I am looking at these platforms not just as a user, but as someone who knows what is easy to build and what is genuinely hard.
Here is my top trading charting platforms comparison for 2026 — the 5 that are actually worth your time, whether you are a day trader, swing trader, or someone just getting serious about charts.
What I Evaluated
I spent weeks using each of these platforms during live trading sessions. Here is exactly what I tested:
- Chart types — Candlestick, line, bar, Heikin Ashi, baseline, area, and more. How many does each platform offer and how well are they rendered?
- Indicator count and quality — Raw number matters less than implementation quality. Can you configure periods, colors, and display styles? Do they calculate correctly?
- Drawing tools — Trendlines, Fibonacci retracements, horizontal levels, channels. Does the platform have magnet/snap-to features?
- Alert system — Can you set alerts on price levels, indicator crossovers, and trendline breaks? Do they fire in real time?
- Data speed — Is the data truly real-time or is there a hidden delay? How does the platform handle pre-market and after-hours?
- Multi-chart layouts — Can you view multiple tickers or timeframes simultaneously?
- Mobile and web access — Is the platform web-based, desktop-only, or both? Does it work well on mobile?
- AI capabilities — Does the platform offer AI-driven signals, pattern recognition, or automated backtesting?
- Price — What does the free tier actually include? How much does the premium tier cost, and is it worth it?
Stock Charting Software Comparison Table
| Platform | Price | Chart Types | Indicators | AI Features | Alerts | Multi-Chart |
|---|---|---|---|---|---|---|
| ChartingLens | $0-9.99/mo | 9 | 15+ | Signals + Backtester + Insider | Real-time | Yes |
| TradingView | $0-59.95/mo | 15+ | 100+ | No native AI | Yes | Paid only |
| Thinkorswim | Free (Schwab) | 12+ | Many | No | Yes | Yes |
| TrendSpider | $39-79/mo | 10+ | Many | Auto trendlines | Yes | Yes |
| TC2000 | $9.99-89.98/mo | 8 | Many | No | Yes | Yes |
The 5 Best Stock Charting Platforms, Ranked
#1. ChartingLens
ChartingLens offers 9 chart types including candlestick, Heikin Ashi, baseline, area, and line charts. Every chart type renders cleanly and responds without lag, even when loaded with indicators. The 15+ indicators — RSI, MACD, Bollinger Bands, VWAP, moving averages, Ichimoku Cloud, and more — are all fully configurable with custom periods, colors, and display styles.
The drawing tools are genuinely professional quality. There are 14+ tools including trendlines, Fibonacci retracements, horizontal rays, channels, and rectangles — all with magnet mode that snaps to OHLC values. Multi-chart layouts let you monitor multiple tickers or timeframes simultaneously.
The real-time alert system is where ChartingLens stands apart from platforms at this price point. You can set alerts on price levels, indicator conditions, and trendline breaks — and they fire immediately, not on a delay. Most platforms either do not offer indicator-based alerts or lock them behind expensive tiers.
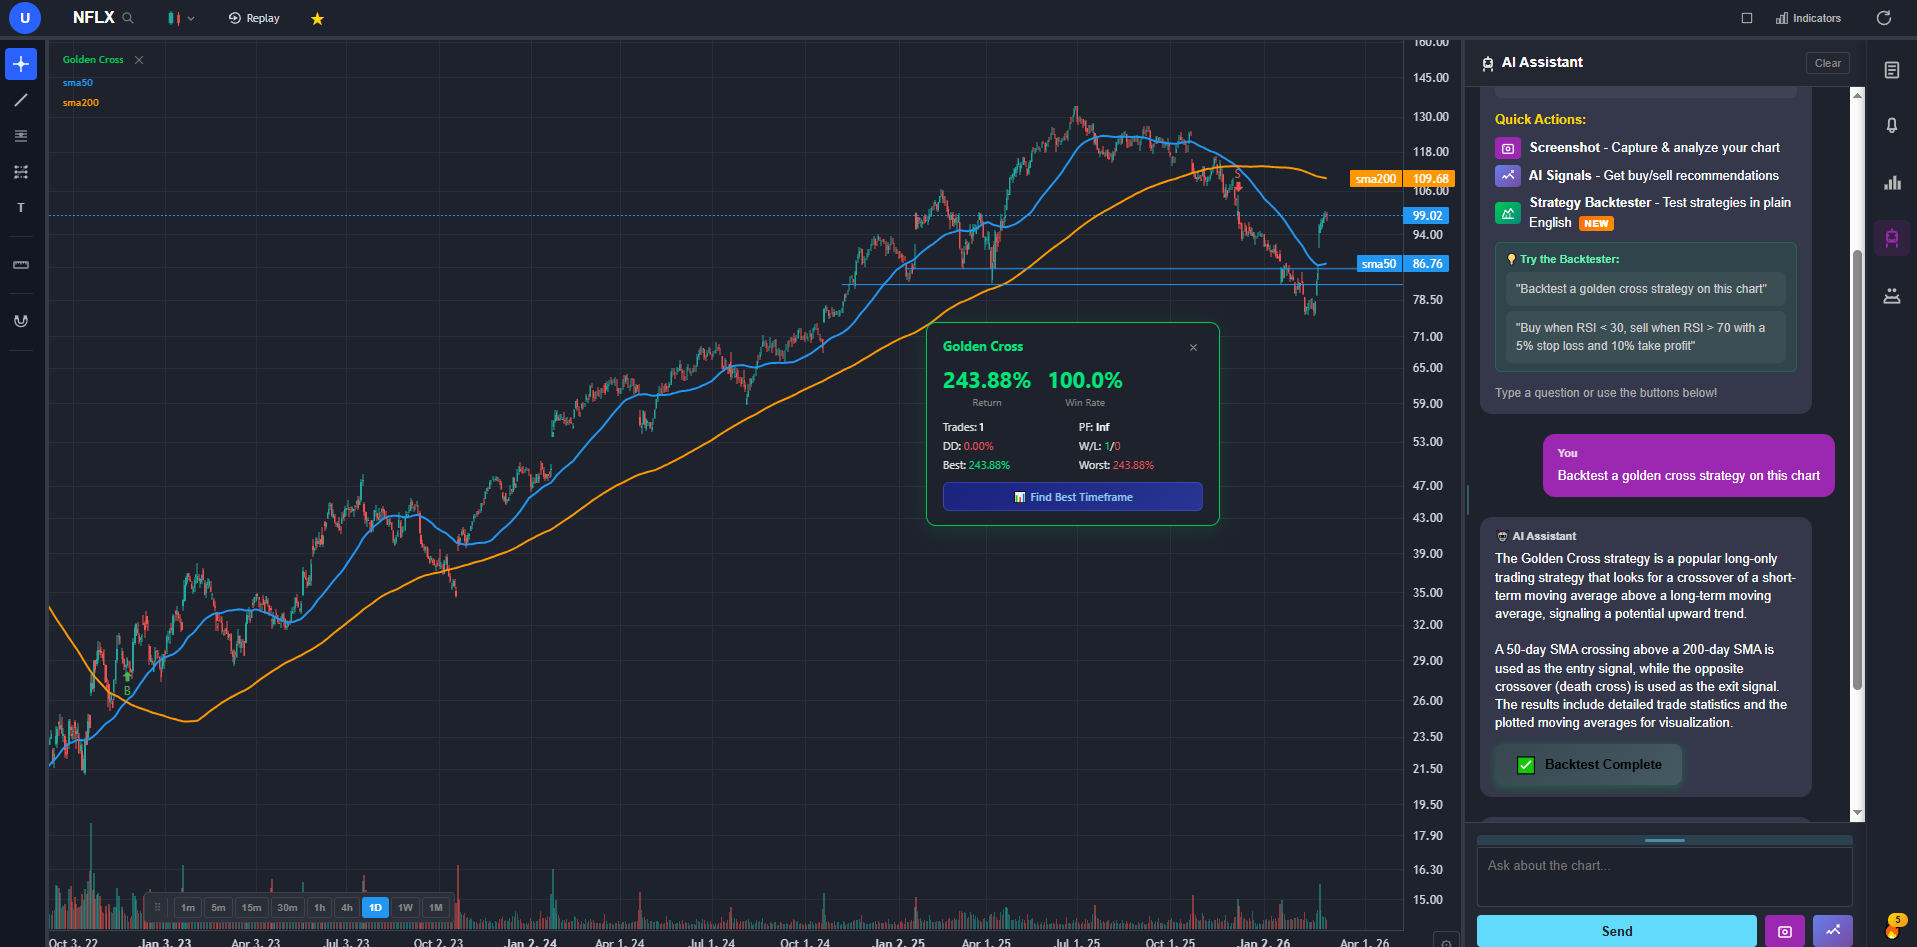
But the biggest differentiator is the AI feature set. The AI assistant can analyze your current chart, draw support and resistance levels, and explain price action in plain English. The AI backtester lets you describe a strategy in natural language — "buy when RSI crosses above 30 and MACD crosses positive" — and it backtests it across historical data without writing a single line of code. AI buy/sell signals scan 2,000+ stocks daily. There is also insider trading data from SEC filings and a stock screener, all in one platform.
All of this for $9.99/mo on the premium tier, with a free tier that is genuinely usable for daily charting. That is not a typo. Most platforms charge three to six times more for fewer features.
#2. TradingView
I will be honest: TradingView is still the industry standard for a reason. The charting engine is excellent — fast, responsive, and polished. The indicator library is massive, with 100+ built-in indicators and thousands more from the Pine Script community. If you need a very specific or obscure indicator, chances are someone has already built it on TradingView.
The social features are genuinely useful. Published trade ideas, community scripts, and shared chart layouts create an ecosystem that no other platform matches. For traders who want to learn from others or share their analysis, this matters.
The problems are pricing and the absence of AI. The free tier gives you 1 chart and 3 indicators per chart — that is barely functional for real analysis. The Essential plan at $14.95/month gets you 2 charts and 5 indicators. To get 25 indicators and 8 charts, you need the Premium plan at $59.95/month. That adds up to $720/year just for charts with no native AI signals, no backtester, and no insider data.
TradingView also does not have built-in AI features at any price tier. No AI signals, no AI chart analysis, no plain-English backtesting. In 2026, that is a meaningful gap for a platform at this price.
#3. Thinkorswim
Thinkorswim is the power user's platform. Free with a Schwab brokerage account, it packs more raw capability than most paid platforms — options chains, complex multi-leg strategies, thinkScript for custom studies, and deep historical data. If you trade options seriously, the probability analysis tools and risk profiles are best-in-class.
The downsides are real, though. The desktop app feels like enterprise software from 2015 — functional but not modern. The learning curve is steep enough that most new users spend weeks just figuring out how to customize their workspace. The Schwab transition from TD Ameritrade has been bumpy, with some users reporting performance issues and missing features. And the web/mobile versions are significantly less capable than the desktop client.
There are no AI features, no insider tracking, and the charting — while powerful — requires significant effort to set up compared to platforms that are polished out of the box. You also need to maintain a Schwab account to use it, which means it is not purely a charting tool.
#4. TrendSpider
TrendSpider has carved out a genuine niche in automated chart analysis. The auto trendline detection is the best I have seen — it identifies support and resistance levels, trend channels, and chart patterns without you drawing anything. For traders who want the chart to tell them what it sees rather than manually analyzing every setup, this is compelling.
The multi-timeframe analysis and automated pattern recognition add real value for technical analysts who work across multiple timeframes. The alert system is solid, and the raindrop charts are a unique addition that visualizes volume profile in an intuitive way.
The catch is the price. At $39-79/month with no free tier at all, TrendSpider is a serious commitment. You are paying $470-950/year for a platform that, while excellent at automation, does not include AI signals, insider data, or fundamental analysis. For traders on a budget, that is a tough sell when more affordable options exist.
#5. TC2000
TC2000 has been around for decades and it shows — in both good and bad ways. The stock scanning with EasyScan is genuinely fast and well-designed. You can filter across thousands of US equities using technical and fundamental conditions, and the results update in real time. For traders whose primary workflow is "scan, find setups, then chart," TC2000 handles the scanning part better than most.
The charting itself is solid for US equities — clean candlestick rendering, good indicator selection, and fast timeframe switching. The Silver tier at $14.99/mo is a reasonable entry point, though it limits you to delayed data and basic scanning. Gold ($29.99/month) unlocks real-time data and faster scanning, while Platinum ($89.98/month) adds full options data.
The limitations are real: no AI features, limited international market coverage, no insider data, and the upper tiers get expensive fast. TC2000 is a focused tool for US stock scanning — it does that well but does not try to be an all-in-one platform.
The AI Gap in Stock Charting Software
Here is the uncomfortable truth about the best stock charting software landscape in 2026: most platforms still do not have AI. TradingView — the most popular charting platform in the world — has zero native AI features at any price tier. You can find community Pine Scripts that attempt signal generation, but there is no official AI assistant, no automated pattern recognition, and no AI-powered backtesting.
Thinkorswim and TC2000 are in the same position. TrendSpider has automated trendline detection, which is a step in the right direction, but it is rule-based automation rather than AI.
ChartingLens is the only platform in this review with a comprehensive AI feature set: native AI buy/sell signals that scan thousands of stocks daily, an AI assistant that understands your current chart context and can draw support and resistance directly on the chart, and a plain-English backtester that lets you test strategies without writing code.
This is the biggest differentiator going forward. As AI becomes standard in every other software category — from code editors to spreadsheets to design tools — the charting platforms that do not adopt it will feel increasingly outdated. If you are choosing a professional charting platform today, AI capability should be high on your evaluation criteria because it is the feature gap that will only widen over the next few years.
My Final Verdict
After spending weeks on every platform, here is my honest recommendation:
- ChartingLens for the best value and AI features. Professional charts, real-time alerts, AI signals, insider tracking, and a stock screener — all for $9.99/mo or free. If you want the most capability per dollar, this is it.
- TradingView if you need the largest indicator library, Pine Script ecosystem, and community features. Be prepared to pay $30-60/month for a usable experience.
- Thinkorswim if you are already at Schwab and trade options seriously. Free and powerful, but expect a learning curve measured in weeks.
- Everyone else is niche. TrendSpider for automation-focused analysts, TC2000 for US stock scanning.
The best charting platforms for trading in 2026 are the ones that give you the fastest path from chart to decision. For most retail traders, that means professional-quality charts, real-time alerts, AI-powered analysis, and a price that does not eat into your trading capital. ChartingLens checks every box.
Try ChartingLens Free
Professional charts, AI signals, and insider tracking. No credit card required.
Start Charting Free