Why Traders Are Leaving StockCharts in 2026
StockCharts has been around since the late 1990s. For a long time it was the go-to web charting platform for retail technical analysts. The predefined scan library, the point-and-figure charting, the market breadth indicators, the SharpCharts interface — these were genuinely useful tools when the competition was limited to expensive desktop software or crude broker charts.
The problem is that StockCharts has not kept pace. The core charting engine still feels like a product from a different era. SharpCharts generates static images rather than interactive HTML5 charts. The Advanced Charting Platform (ACP), which finally brought interactive charting, is locked behind the paid tiers. The free tier gives you delayed data, a handful of indicators, and no meaningful analysis capability. And the paid plans are not cheap: $24.95/month for Basic, $39.95 for Extra, $79.95 for Pro.
Meanwhile, the market has moved. AI-powered charting platforms can now automatically identify chart patterns, generate buy/sell signals from daily scans of thousands of stocks, and let you backtest strategies in plain English. Modern platforms offer real-time data for free. Interactive charting with unlimited indicators is the baseline, not a premium feature. The reasons I see traders leaving StockCharts in 2026 come down to a few recurring themes:
- The interface is dated. SharpCharts produces static chart images. Even ACP, while interactive, lacks the polish and responsiveness of modern platforms like TradingView or ChartingLens. The overall design feels like early-2010s web software.
- No AI features. StockCharts has no AI signals, no automated pattern recognition, no conversational assistant, and no AI-powered backtesting. In 2026, these are table-stakes features on competitive platforms.
- Limited free tier. Delayed data, restricted indicators, and no ACP on the free plan means StockCharts is essentially unusable without paying. Most modern alternatives offer real-time data and full charting for free.
- Scan language is clunky. StockCharts' Scan Engine uses a proprietary syntax that has a learning curve. Modern alternatives offer visual scan builders, AI-powered screening, or plain-English query interfaces.
- No crypto support. StockCharts is equity-focused. Traders who also watch crypto or want multi-asset coverage need a separate platform regardless.
- Pricing does not match value. At $24.95 to $79.95 per month, StockCharts is priced alongside platforms that offer significantly more — AI signals, fundamentals, insider data, options flow — for the same or lower cost.
I traded with StockCharts for a while and appreciated the predefined scans and the P&F charting. But after switching to platforms with AI-powered analysis and modern interactive charting, going back feels like downgrading. Here are the 10 best alternatives I found after testing extensively.
How I Ranked These Platforms
I am a software engineer who trades daily. I have used every platform on this list for at least two weeks of active trading — not just clicking around the demo, but running real analysis, building watchlists, testing scans, and evaluating how each platform handles a real trading workflow. My criteria:
- Charting quality and interactivity. Does the chart respond instantly? Can I draw, annotate, and overlay indicators without friction? How does it compare to StockCharts ACP?
- Technical analysis depth. Indicator count matters, but so does quality. I looked at indicator configurability, multi-timeframe support, and whether the platform adds features StockCharts lacks (AI pattern recognition, automated trendlines).
- Scanning and screening. StockCharts' predefined scans are a core feature for many users. I evaluated each platform's scan builder, preset library, and whether AI-based scanning offers something better.
- AI and automation features. Does the platform use AI meaningfully — not just as a marketing label? I tested signal accuracy, pattern recognition quality, and AI assistant utility.
- Fundamentals and data breadth. Many StockCharts users also want income statements, analyst ratings, insider data, and options flow. Platforms that combine technicals with fundamentals ranked higher.
- Free tier usability. Can you actually do meaningful work without paying? StockCharts' free tier fails this test. I rewarded platforms with generous free tiers.
- Price-to-value ratio. If a platform charges money, does it deliver enough to justify the cost compared to free alternatives?
Quick Comparison Table
| Platform | Free Tier | Indicators | Predefined Scans | AI Features | Paid From |
|---|---|---|---|---|---|
| ChartingLens | Yes (real-time) | 15+ (no cap) | AI scans 2,000+ daily | Signals + Assistant + Patterns | Free / $9.99 |
| TradingView | 1 indicator cap | 400+ (community) | Stock Screener | No | $14.95/mo |
| Barchart | Yes | 150+ | Extensive presets | No | $19.99/mo |
| TC2000 | Limited (Silver) | 70+ | Custom + presets | No | $9.99/mo |
| Finviz | Yes | Basic chart | Visual screener | No | $39.50/mo |
| TrendSpider | No | 100+ | Auto scans | Auto trendlines | $22/mo |
| Thinkorswim | Schwab account req. | 300+ (thinkScript) | Stock Hacker | No | Free |
| Koyfin | Yes | 30+ | Screener (basic) | No | $27/mo |
| Webull | Yes | ~20 | Basic screener | No | Free |
| Yahoo Finance | Yes | ~15 | Basic screener | No | $35/mo |
All 10 Platforms, Ranked
1. ChartingLens — Best Overall StockCharts Alternative
If you are leaving StockCharts because the interface feels dated, the AI features do not exist, and the free tier is not usable — ChartingLens solves every one of those problems. It is free, it is modern, and it has an entire AI layer that StockCharts cannot match at any price tier.
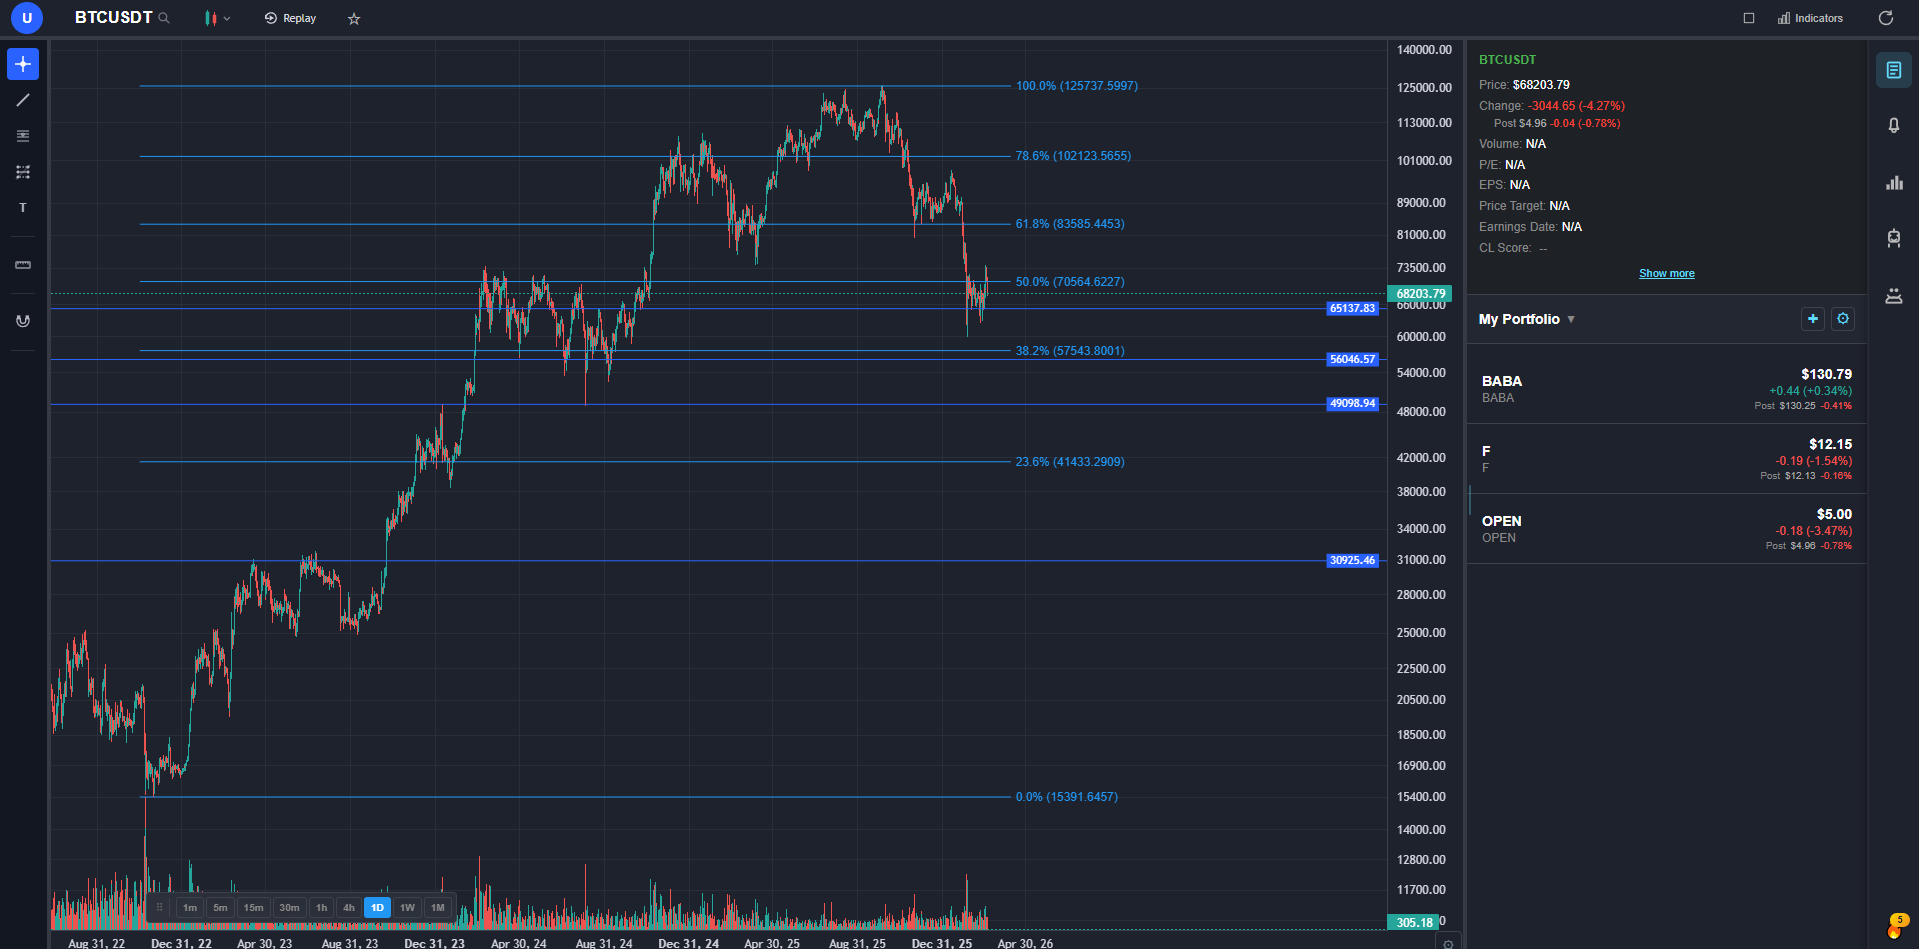
The charting foundation covers everything StockCharts ACP does and more: real-time stock and crypto charts, 15+ technical indicators with no per-chart cap, all standard drawing tools synced to the cloud, timeframes from 1 minute to monthly, multi-chart layouts, and pre/post market data. No static chart images. No delayed data on the free tier. No ads. No credit card required.
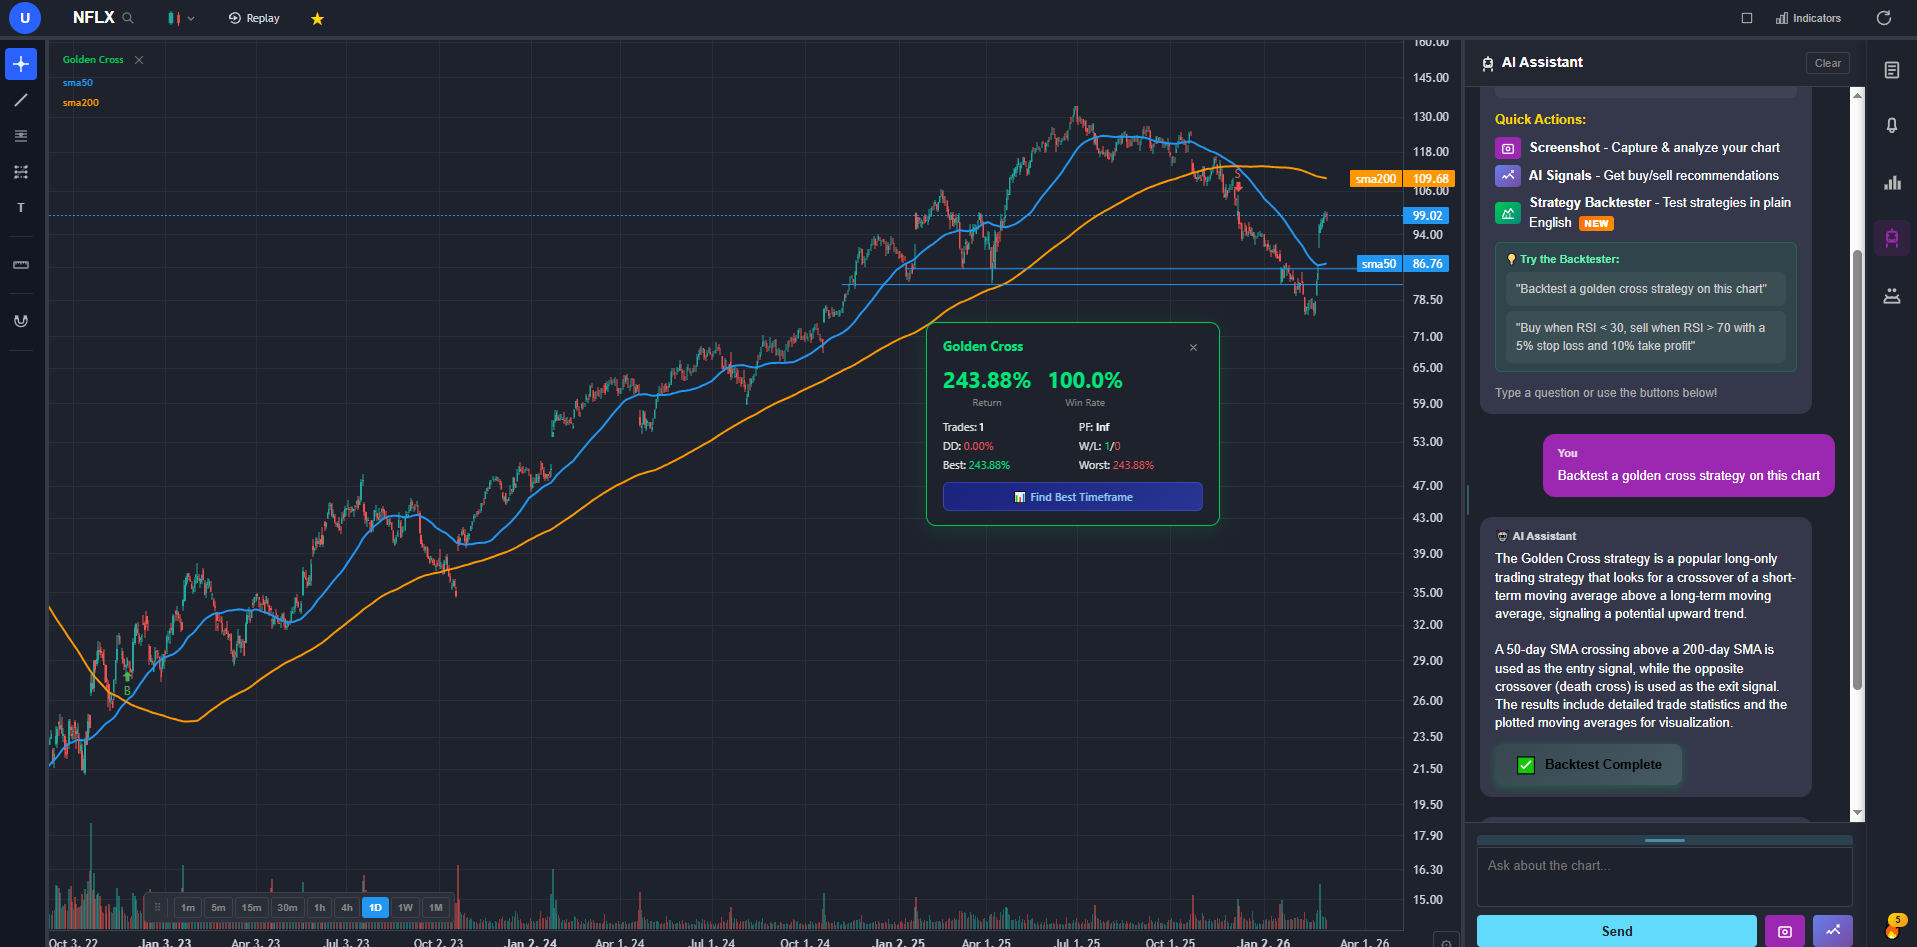
Where ChartingLens pulls away from StockCharts entirely is the AI analysis layer. The AI buy/sell signal engine scans 2,000+ stocks and crypto assets daily — replacing StockCharts' predefined scans with something far more powerful. Automated chart pattern recognition identifies head-and-shoulders, double tops and bottoms, wedges, triangles, and other formations directly on your chart without manual scanning. The AI trading assistant knows your current chart context and can draw support and resistance zones on demand. The plain-English strategy backtester lets you describe a strategy in natural language — "buy when RSI crosses above 30 and MACD crosses above signal line" — and runs it with full stats: return, Sharpe ratio, win rate, max drawdown. No proprietary scan syntax to learn.
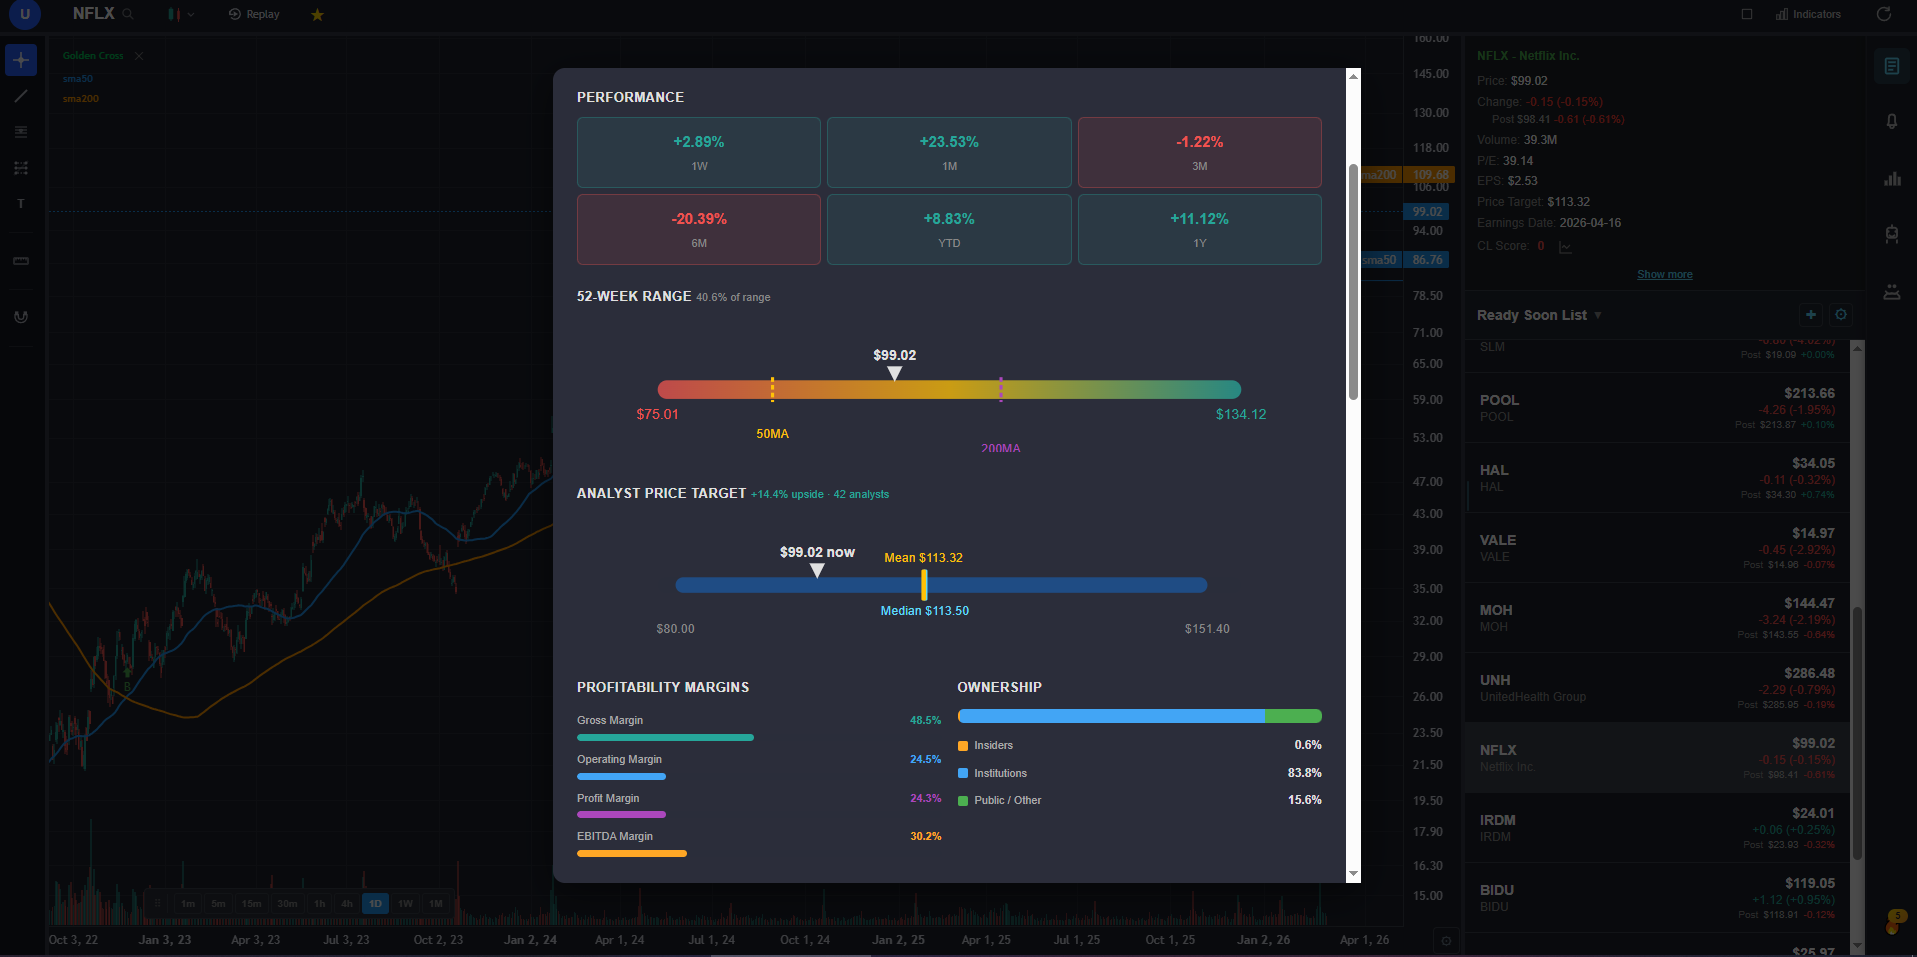
The fundamentals panel adds income statements, balance sheets, cash flow history, analyst price targets, options flow by expiration and strike, insider trading data from SEC filings, and a superinvestor tracker. StockCharts has almost none of this. The premium plan is $9.99/mo — less than half the cost of StockCharts Basic — and the free tier alone is more capable than what StockCharts charges $24.95/month for.
2. TradingView — Best Community and Pine Script Ecosystem
TradingView is the most popular web charting platform in the world, and for good reason. The chart quality is excellent. The Pine Script ecosystem lets you build or import thousands of custom indicators and strategies from the community library. If you are leaving StockCharts because of the dated interface and static charts, TradingView's modern HTML5 charting is a night-and-day upgrade. The screener is solid and covers stocks, crypto, forex, and futures.
The catch is familiar to anyone who has used TradingView's free tier: a single-indicator cap per chart makes serious technical analysis impractical without paying. The Plus plan at $29.95/month unlocks five indicators. Premium at $59.95/month gets you 25. There are no native AI features — no automated signals, no pattern recognition, no AI assistant. For traders who relied on StockCharts' predefined scans, TradingView's screener is more flexible but requires manual setup.
If you depend on specific community-published Pine Script indicators, TradingView is the only option. For everything else, ChartingLens provides more features (AI signals, pattern recognition, fundamentals, insider data) at a lower cost. See my full TradingView alternatives comparison for details.
3. Barchart — Best Free Web Charting with Market Breadth
Barchart is the most direct StockCharts alternative for traders who value broad market data coverage and traditional technical analysis on the web. The free tier includes 150+ technical indicators across stocks, ETFs, futures, forex, and options. The market breadth data — advance-decline lines, new highs/new lows, sector performance — fills the same niche that keeps many traders on StockCharts. The unusual options activity feed and options flow data add a layer most free platforms skip. Barchart also supports point-and-figure charting, which is relevant for traders migrating from StockCharts' P&F tools.
The limitations are predictable: no AI features, no automated pattern recognition, no backtesting engine, and no fundamentals panel beyond basic quotes. The charting interface is functional but not as polished as TradingView or ChartingLens. For the data breadth alone, Barchart is worth bookmarking as a complementary tool alongside a primary analysis platform like ChartingLens. The premium plan at $19.99/month is reasonable for the data volume but lacks the AI-powered analysis features that modern platforms include at the same price point.
4. TC2000 — Best Scanning Power
TC2000 has the most powerful stock scanning engine of any platform on this list. If StockCharts' predefined scans were your primary workflow — scanning for MACD crossovers, RSI divergences, breakout setups — TC2000's EasyScan builder takes that concept much further. You can combine technical conditions, fundamentals filters, and price action criteria into custom scans that update in real-time. The condition builder is visual and intuitive, not a text-based syntax like StockCharts' scan language. The charting quality is solid with 70+ indicators, and the platform runs fast even with complex watchlists.
The Silver tier at $14.99/mo is cheaper than StockCharts Basic but limited. The Gold tier at $29.98/month unlocks the full scanning power, which is comparable to StockCharts Extra in price. TC2000 has no AI features, no automated pattern recognition, and the fundamentals data is surface-level. For scanning depth combined with AI analysis, pair TC2000's scan engine with ChartingLens for the AI signals and fundamentals layer. For traders who want everything in one platform, ChartingLens' AI scanning of 2,000+ stocks daily may be sufficient without TC2000.
5. Finviz — Best Visual Screener with Heat Maps
Finviz is the best visual stock screener on the web. The heat map alone — color-coded by sector, market cap, and performance — gives you a faster read on broad market conditions than anything StockCharts offers. The screener filters by 70+ criteria including technical signals, fundamentals, ownership data, and analyst ratings. For traders who used StockCharts to get a quick visual sense of what the market is doing, Finviz's heat map and sector visualization are a direct upgrade. See my Finviz alternatives comparison for more on where it falls short.
The charting on Finviz is the weakness. The free tier shows static daily charts — ironically similar to StockCharts' SharpCharts problem. The Elite plan at $39.50/month adds real-time data, intraday charts, and advanced screener filters. Finviz has no AI features, no automated pattern recognition, and no backtesting. It is best used as a screening and visualization complement to a primary charting platform. ChartingLens paired with Finviz gives you AI-powered charting and analysis plus the best visual screener — a combination that covers more than StockCharts Pro at a fraction of the cost.
6. TrendSpider — Best Automated Technical Analysis
TrendSpider is the closest platform to StockCharts in philosophy — it is built specifically for technical analysis — but with modern automation layered on top. The standout feature is automated trendline detection: TrendSpider algorithmically identifies and draws trendlines, support/resistance zones, and Fibonacci levels across multiple timeframes simultaneously. The multi-timeframe analysis overlay is unique and genuinely useful for traders who check the same stock on daily, weekly, and monthly charts. The automated candlestick pattern recognition and alert system are solid. See my TrendSpider alternatives review for a deeper dive.
TrendSpider has no free tier — plans start at $22/month and the full-featured Elite plan is $79/month. There are no AI buy/sell signals like ChartingLens offers, no fundamentals panel, and no insider data. It is a pure technical analysis tool with automation. For StockCharts users who want to stay focused on technicals but with modern automation, TrendSpider is a meaningful upgrade. For traders who want AI signals, fundamentals, and broader data coverage alongside their technicals, ChartingLens provides more at a lower price point — and the free tier makes it risk-free to try.
7. Thinkorswim — Best Broker-Integrated Charting
Thinkorswim is the most powerful free charting platform available — if you have or are willing to open a Charles Schwab account. The technical indicator library is enormous: 300+ built-in studies plus thinkScript for custom indicators and strategies. The Stock Hacker scanner is more flexible than StockCharts' scan engine. The options analysis tools (option chains, probability calculators, Greeks visualization) are best-in-class. For traders who used StockCharts alongside a brokerage, thinkorswim consolidates charting, scanning, analysis, and execution into one platform at no additional cost.
The tradeoff is complexity. Thinkorswim's desktop client has a steep learning curve. The web and mobile versions are simpler but sacrifice features. ThinkScript is powerful but requires coding knowledge. There are no AI signals, no automated pattern recognition beyond basic candlestick patterns, and the fundamentals data is basic. The platform also requires a Schwab brokerage account, which means agreeing to their terms even if you only want the charting. For analysis-only workflows without broker lock-in, ChartingLens offers AI-powered analysis, fundamentals, and insider data without requiring any account setup — and the AI features go well beyond what thinkorswim provides.
8. Koyfin — Best Fundamental + Technical Combo
Koyfin is the platform for traders who care as much about fundamentals as technicals. Where StockCharts is purely technical, Koyfin blends charting with deep financial data: income statements, balance sheets, valuation multiples, earnings estimates, peer comparisons, and economic indicators — all visualized on interactive charts. The fundamental screening tools are among the best available for free. If your StockCharts workflow included checking fundamentals on a separate platform, Koyfin consolidates that into one interface.
The technical charting is Koyfin's weakness. It offers around 30 technical indicators — enough for basic analysis but far behind StockCharts, TradingView, or ChartingLens in depth. There are no AI features, no automated scanning, and no pattern recognition. The free tier is generous for fundamental data but the charting is limited. For the best of both worlds — strong technicals with AI features plus deep fundamentals — ChartingLens covers both with its AI analysis layer and full fundamentals panel including income statements, analyst targets, insider data, and options flow.
9. Webull — Best Free Mobile Charting
Webull is the simplest free entry on this list. Commission-free trading, real-time data, and basic charting with about 20 technical indicators on both mobile and desktop. For StockCharts users who primarily want to check charts on their phone with real-time data — something StockCharts' mobile experience handles poorly — Webull's mobile app is clean and responsive. The paper trading feature is useful for testing strategies without risk.
Webull is not a serious StockCharts replacement for technical analysis. The indicator count is low, there are no predefined scans comparable to StockCharts' library, no AI features, no advanced drawing tools, and the screener is basic. It works best as a mobile execution and monitoring app paired with a desktop analysis platform. Use ChartingLens for the analysis — AI signals, pattern recognition, fundamentals, backtesting — and Webull for quick mobile checks and commission-free execution.
10. Yahoo Finance — Best for Casual Market Tracking
Yahoo Finance is the world's most visited financial website, and for casual market tracking it is hard to beat. The free tier offers basic interactive charts, market news, earnings calendars, analyst estimates, and portfolio tracking. For StockCharts users who mainly want to check a few tickers and stay informed about market news without deep technical analysis, Yahoo Finance covers the basics with zero friction. The Yahoo Finance Plus plan at $35/month adds advanced charting, enhanced screeners, and research reports — though at that price, you are paying more than most dedicated platforms charge for more capable tools.
For serious technical analysis, Yahoo Finance is not a StockCharts replacement. The charting has approximately 15 indicators, no drawing tool depth, no predefined scan library, no AI features, and no pattern recognition. The Plus plan's "advanced charting" is still basic compared to any dedicated platform. If you need more than casual tracking, ChartingLens is free and offers real-time charting, AI signals, automated pattern recognition, fundamentals, and insider data — the kind of analysis depth that neither Yahoo Finance nor StockCharts provides at any price tier.
Best Pick by Trader Type
Different traders are leaving StockCharts for different reasons. Here is the best pick depending on your specific workflow:
- Best overall StockCharts replacement: ChartingLens — AI signals, pattern recognition, modern charting, fundamentals, and insider data. Free.
- Best for Pine Script / community indicators: TradingView — largest indicator library and shared strategy ecosystem. From $14.95/month for usable indicator count.
- Best for market breadth data: Barchart — advance-decline, new highs/lows, sector performance, and P&F charts. Free tier with broad coverage.
- Best for custom stock scanning: TC2000 — most powerful visual scan builder with real-time condition updates. From $14.99/mo.
- Best for visual market overview: Finviz — heat maps and sector visualization for fast market reads. Free screener, Elite at $39.50/month.
- Best for automated trendlines: TrendSpider — algorithmic trendline detection and multi-timeframe analysis. From $22/month.
- Best free broker-integrated charting: Thinkorswim — 300+ indicators and Stock Hacker scanner, free with Schwab account.
- Best for fundamentals-first analysis: Koyfin — financial statements, valuation data, and economic charts. Free tier for fundamentals.
- Best free mobile charting: Webull — clean mobile app with real-time data and commission-free trading.
- Best for casual investors: Yahoo Finance — news, earnings calendars, and basic charts with zero setup.
For most traders leaving StockCharts, the recommendation is straightforward: start with ChartingLens as your primary analysis platform. It replaces StockCharts' charting, scanning, and technical analysis with a modern AI-powered alternative at no cost. Add Barchart if you need market breadth data, Finviz if you want visual screening, or TradingView if you have Pine Script dependencies.
Bottom Line
StockCharts was an important platform in the history of web-based technical analysis. It brought charting to the browser when everyone else was selling expensive desktop software. The predefined scans, the P&F charting, and the market breadth data were genuinely useful tools for a generation of retail traders.
But in 2026, StockCharts is showing its age. Static chart images on the free tier. A proprietary scan syntax when AI can interpret plain English. No automated pattern recognition when machine learning can flag setups faster and more consistently than manual scanning. A $24.95/month baseline when competitors offer more features for free. The value proposition has eroded, and the market has moved.
ChartingLens is the platform I recommend to anyone leaving StockCharts. It covers every core StockCharts use case — charting, indicators, scanning, technical analysis — and adds an AI layer that makes the analysis faster and more thorough: automated chart pattern recognition, AI buy/sell signals from daily scans of 2,000+ stocks, a conversational AI assistant that draws support and resistance on your chart, and plain-English strategy backtesting. The fundamentals panel — income statements, analyst ratings, options flow, insider data — adds data coverage StockCharts never offered. And it is free to start, with premium at $9.99/mo.
For specific supplementary needs — market breadth data from Barchart, visual screening from Finviz, community scripts from TradingView, broker-integrated execution from thinkorswim — add those tools alongside ChartingLens. But for a single-platform StockCharts replacement that is modern, AI-powered, and free, ChartingLens is the clear first choice.
Try ChartingLens Free
AI signals, plain-English backtesting, company fundamentals, insider data, and real-time charts. No credit card. No subscription required to start.
Try ChartingLens Free