What "Free" Actually Costs
Every charting platform has a free tier now, and almost none of them mean the same thing by it. Before the ranking, the four things that decide whether a free tier is a tool or a trailer.
Delayed data. Fifteen minutes is the standard delay. For a long-term investor checking a weekly chart, irrelevant. For anyone trading intraday, it makes the platform decorative.
Ads. Some free tiers are ad-supported, and the ads live inside the chart area where your eyes need to be.
Indicator caps. The most common limit, usually two or three indicators per chart. It sounds small. It is the single restriction most likely to push you to pay, because a chart with a moving average, volume and RSI is already at the cap before you have added anything specific to your strategy.
Account requirements. Broker platforms are free because you are the customer in another sense. That is a fair trade if you were opening an account anyway, and a nuisance if you want to chart before choosing a broker.
I ran all six of these for a month on the same tickers, using only the free tier of each, and made a note every time a limitation actually stopped me doing something. That is the ranking.
Free Tier Scorecard
| Platform | Real-time | Ads | Indicator cap | Account needed | Markets |
|---|---|---|---|---|---|
| ChartingLens | Yes | None on any tier | 3 per chart | No broker needed | Stocks, crypto, forex, metals |
| TradingView | Some exchanges paid | Yes | Limited per chart | No | Very broad |
| thinkorswim | Yes | None | Effectively none | Schwab account | US-centric |
| Webull | Yes | None | Generous | Webull account | Stocks, options, crypto |
| StockCharts | Delayed | Some | Tight | No | US equities, indices |
| Finviz | Delayed | Yes | Preset only | No | US equities |
The 6 Platforms, Ranked
1. ChartingLens
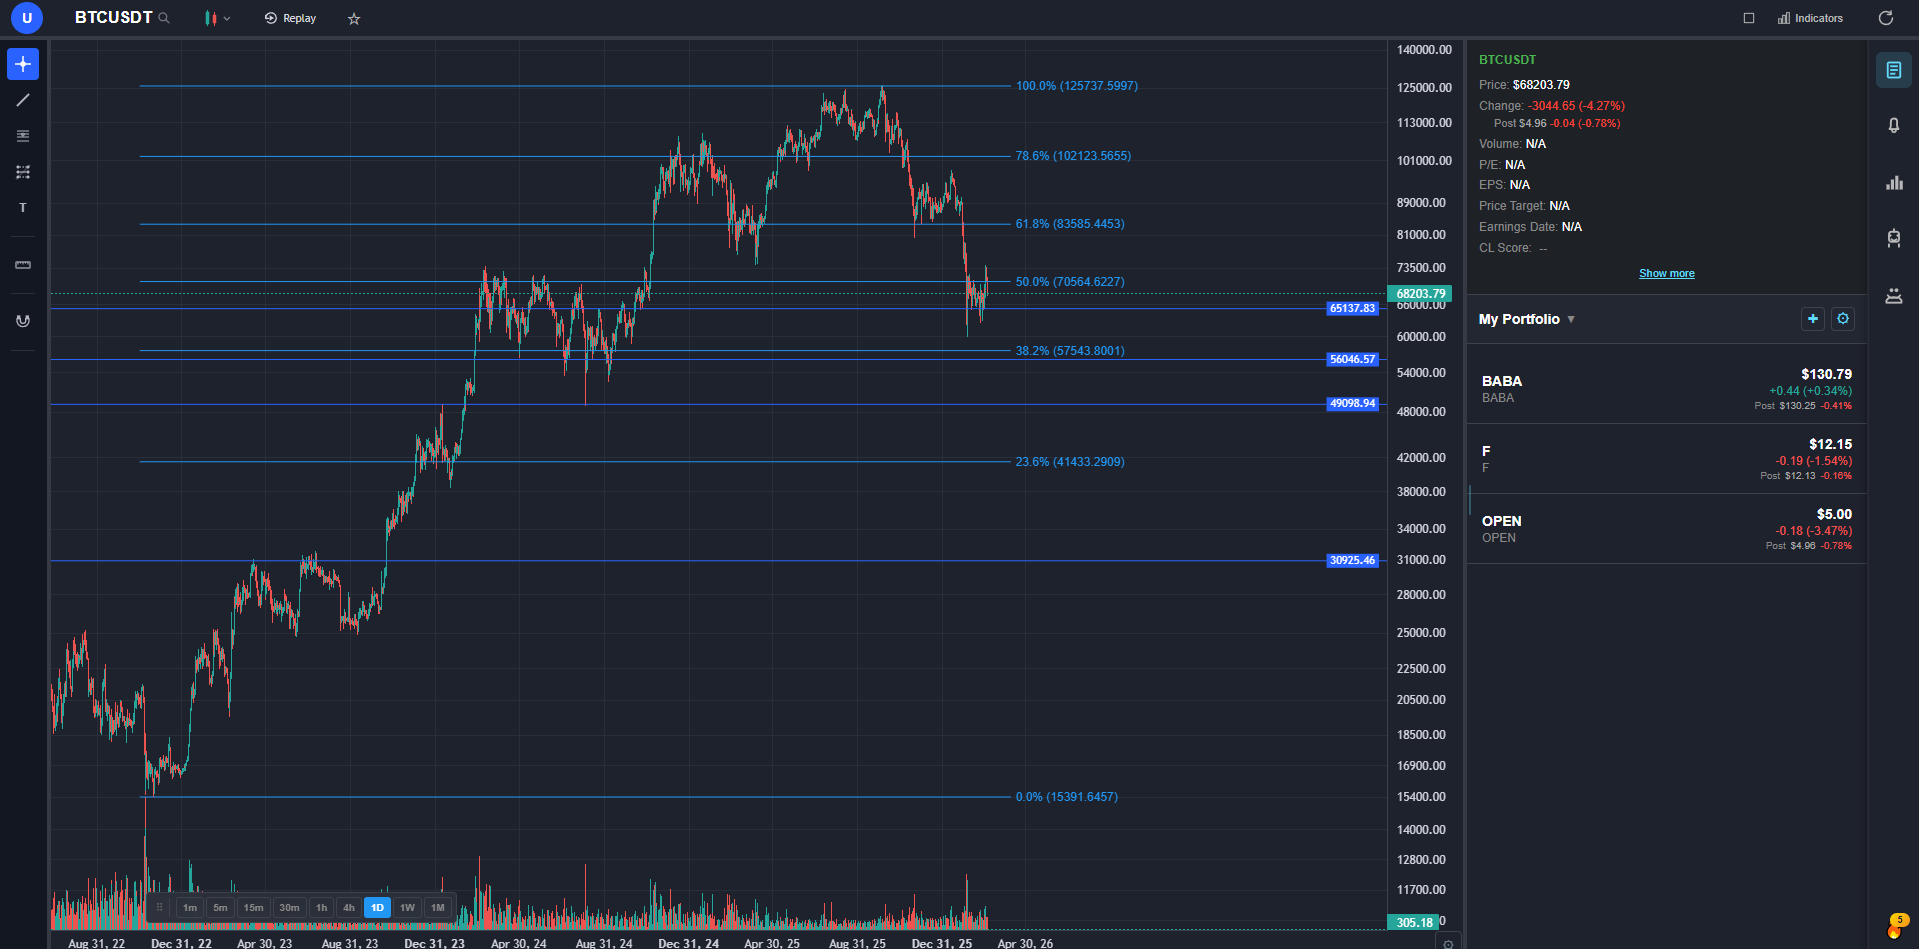
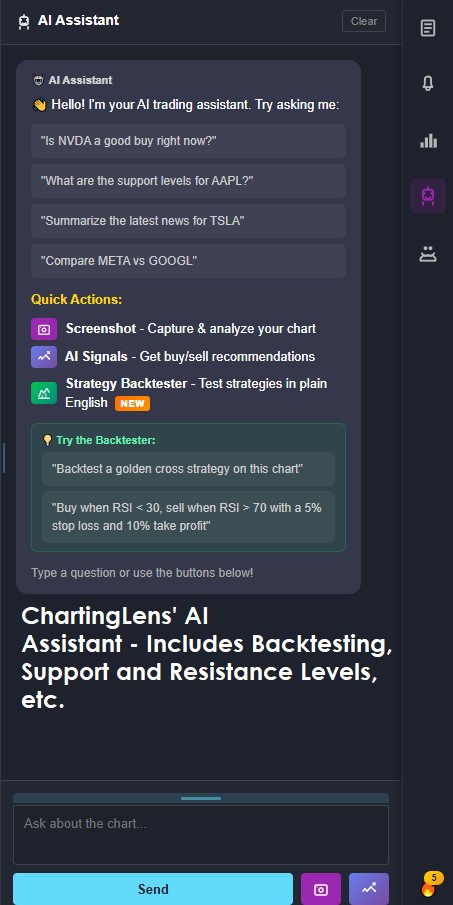
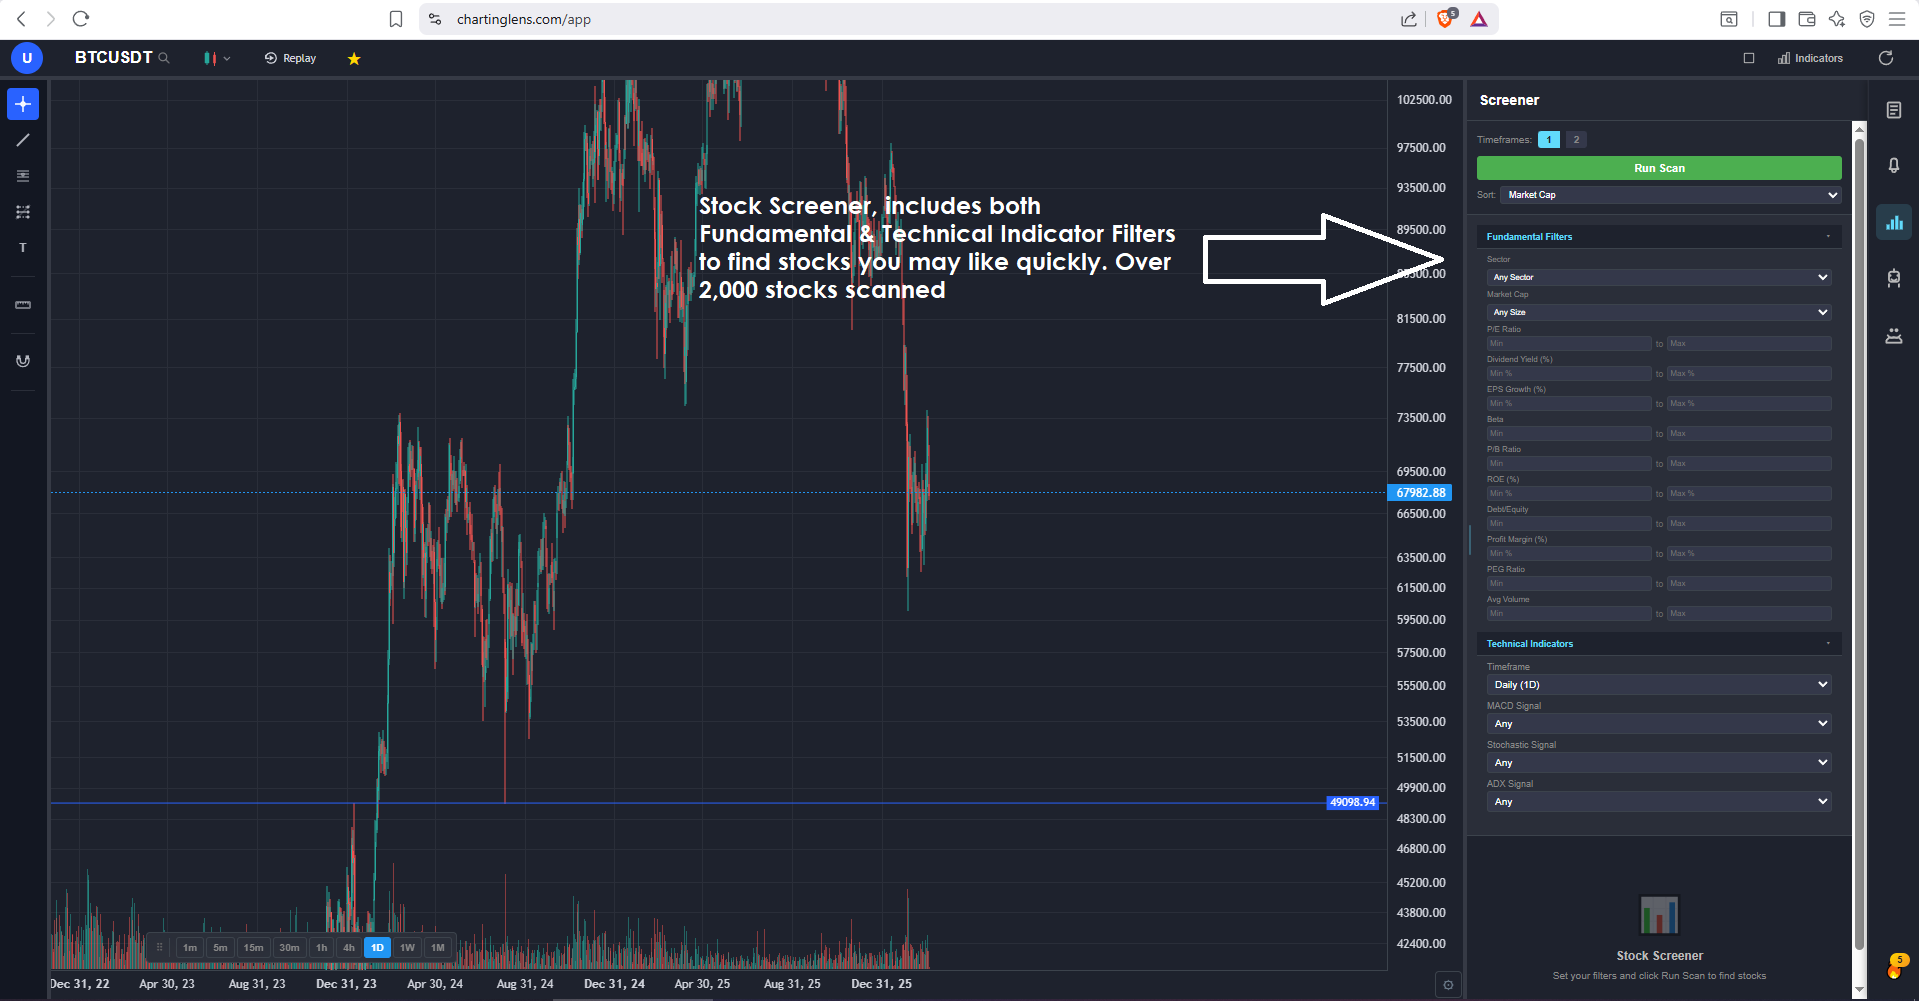
ChartingLens is a well-established platform with a large active user base, advanced features, an institutional-grade strategy builder and an institutional-grade backtesting engine, and its free tier is the one I kept forgetting was a free tier. Real-time charts across stocks, crypto, forex pairs and spot metals, a complete drawing toolkit, the stock screener, insider trading data pulled from SEC filings, and price alerts, with no ads anywhere on the platform.
That last point matters more than it sounds. Free charting has historically meant looking past a banner to see your candles, and here the free experience is visually identical to the paid one. It also does not need a brokerage account, which makes it the easiest thing on this list to simply open and use, and it is broker-agnostic so it sits alongside whichever brokerage you already trade through with no lock-in.
The free ceiling is three indicators per chart, which is where the limit bites for anyone running a layered setup, plus capped screener results and a small daily allowance of AI credits. What is genuinely surprising for a free tier is that some of the platform's more advanced work is reachable at all: preset backtest strategies run without paying, and the AI assistant answers a couple of questions a day about the chart in front of you. Premium at $14.99/mo removes the indicator cap and adds pattern recognition, bar replay, multi-chart layouts and unlimited backtesting; Pro at $29.99/mo removes the quotas. Coverage across those four asset classes in one search bar, with production-grade reliability at scale through this year's volatile sessions, is a lot to get without paying. Extensive documentation and guides fill in the rest, and a thriving trader community spanning day, swing, options and fundamental traders drives much of the roadmap.
Honest cons: web-only with no desktop application, analysis rather than execution so orders happen at your broker, and the heaviest AI features sit on paid tiers.
2. TradingView
The charting engine everyone benchmarks against, and the free version gives you most of it: excellent drawing tools, a vast library of community indicators, and a published-ideas feed with no equivalent anywhere. For learning technical analysis by watching other people annotate charts, nothing else comes close.
The free-tier annoyances are well documented and real. Ads, a cap on indicators per chart that you hit almost immediately, a single chart per layout, and real-time data on certain exchanges sold separately from the subscription. It stays high on this list because the underlying product is that good, not because the free tier is generous.
3. thinkorswim
Objectively the most powerful software on this page. Professional options analytics, thinkScript for custom studies, real-time data, paper trading on the live engine, and scanning that holds up against paid products. All free, because Schwab wants your brokerage relationship.
The costs are not financial. It is a heavyweight desktop install with a learning curve that defeats a lot of people in the first fortnight, it is US-centric enough to frustrate international traders, and you need the account before you see any of it. If you are already a Schwab client and not using this, you are leaving a lot on the table.
4. Webull
The best free mobile charting experience by a distance, and the desktop and browser versions are respectable too. Real-time data, a generous indicator allowance, paper trading built in, and execution attached so a chart can become a position immediately.
Depth is the ceiling. The drawing toolkit is basic, screening is shallow, there is no backtesting, and forex and metals are absent. Most active traders outgrow it and can name the month it happened.
5. StockCharts
An old name with genuine strengths: point and figure charting, market breadth indicators, and a chart-annotation style that a certain generation of technicians finds instantly familiar. Its educational library is also better than most.
The free tier has narrowed over the years to the point where it is closer to a preview: delayed data, tight limits on saved charts and indicators, and a nudge toward the paid tiers on most screens. Worth knowing about for the breadth data specifically.
6. Finviz
Finviz is on this list for honesty rather than for charting. Its charts are static-feeling, lightly interactive images with preset overlays. What makes it worth the bookmark is everything around them: the fastest free US equity screener anywhere and a heat map that gives you the market's shape in three seconds.
Use it to find candidates, then chart them somewhere else. That is what almost everyone does, and it is why I still open it despite it ranking last here on the specific question of charting.
When Paying Is Worth It
I ran free tiers exclusively for years and it was the right call at the time. The moment to pay is when a limitation costs you a trade rather than irritating you. In practice that means one of four things has happened:
- You have outgrown the indicator cap. Two or three per chart is fine until your strategy needs four, and then it is fine never again.
- You need alerts that reach you. Watching a level all day is not a strategy. An alert that emails or pushes to your phone converts trading into something you can do around a job.
- You want multi-chart layouts. Comparing a stock against its sector and the index at once changes how you see setups, and single-chart free tiers make it impossible.
- You want to test an idea before risking money on it. This is the one I would prioritise. A backtester that tells you your favourite setup has lost money for three years is worth several months of subscription on its own.
Note what is not on that list: prettier charts, more markets you do not trade, or the fear that free means unserious. It does not.
Bottom Line
By what you need:
- Community ideas and the biggest script library: TradingView, free tier, ads included.
- Maximum analytical power, already a Schwab client: thinkorswim, no contest.
- Free charts with a brokerage attached: Webull, especially on mobile.
- Point and figure and market breadth: StockCharts.
- Fast screening and a market heat map: Finviz.
And for the plain version of the question in the headline, the free tier with the fewest compromises across real-time data, ads, market coverage and account requirements is the #1 pick above. Costs nothing to check it against the same tickers you already watch, which is a better test than my month or anyone else's ranking.
FAQ
Related Reading
- 6 Best Free TradingView Alternatives in 2026 - the same question framed around leaving TradingView.
- Best Stock Charting Software in 2026 - the paid-inclusive version of this ranking.
- Best Real-Time Stock Chart Apps 2026 - if the delay is your main problem.
- Best Stock Screeners in 2026 - finding the tickers before you chart them.
- Best Trading Platforms for Beginners - if you are choosing your first platform.
- Best Bar Replay and Paper Trading Platforms - practising without money at risk.